Deck 18: Simple Linear Regression and Correlation
ملء الشاشة (f)
سؤال
Which of the following best describes the relationship of the least squares regression line: Estimated y = 2 - x? 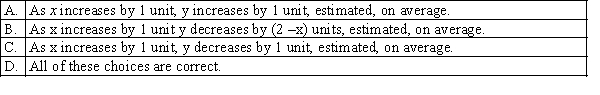
سؤال
The regression line Estimated y = 3 + 2x has been fitted to the data points (4,8), (2,5), and (1,2). The sum of the squared residuals will be: 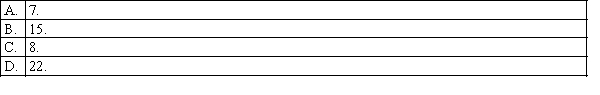
سؤال
Which of the following statements best describes correlation analysis in a simple linear regression? 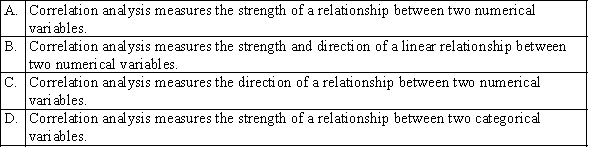
سؤال
Given a specific value of x and confidence level, which of the following statements is correct? 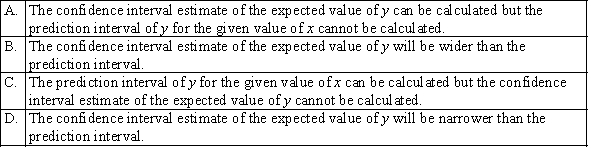
سؤال
If an estimated regression line has a y-intercept of 10 and a slope of -5, then when x = 0, the estimated value of y is: 
سؤال
Given that the sum of squares for error is 50 and the sum of squares for regression is 140, the coefficient of determination is: 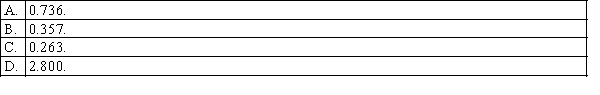
سؤال
The Spearman rank correlation coefficient must be used to determine whether a relationship exists between two variables when: 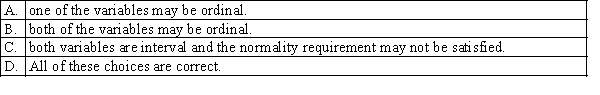
سؤال
The symbol for the population coefficient of correlation is: 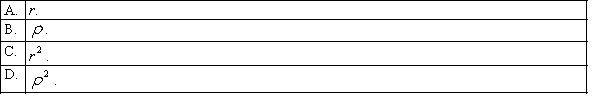
سؤال
If the coefficient of correlation is 0.80, the percentage of the variation in y that is explained by the variation in x is: 
سؤال
In regression analysis, if the coefficient of determination is 1.0, then: 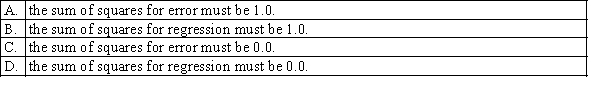
سؤال
Given the least squares regression line y-hat = 3.52 - 1.27x, and a coefficient of determination of 0.81, the coefficient of correlation is: 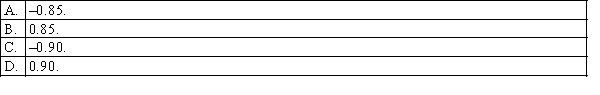
سؤال
A regression line using 25 observations produced SSR = 118.68 and SSE = 56.32. The standard error of estimate was: 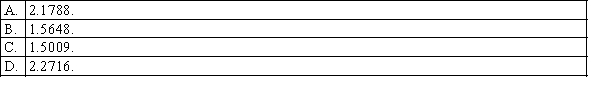
سؤال
Given that ssx = 2500, ssy = 3750, ssxy = 500 and n = 6, the standard error of estimate is: 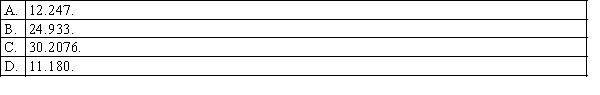
سؤال
سؤال
Which of the following best describes the value of the slope, if the coefficient of determination is 0.95? 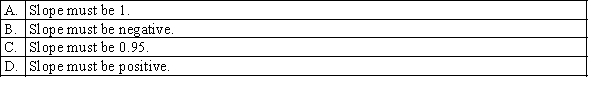
سؤال
In simple linear regression, most often we perform a two-tail test of the population slope  to determine whether there is sufficient evidence to infer that a linear relationship exists. Which of the following best describes the null and alternative hypotheses needed for a test of significance?
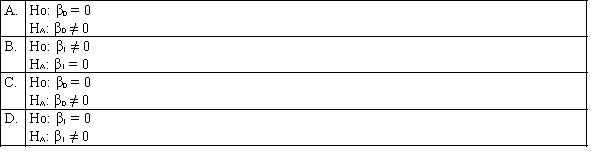
to determine whether there is sufficient evidence to infer that a linear relationship exists. Which of the following best describes the null and alternative hypotheses needed for a test of significance? سؤال
If the coefficient of correlation is −0.50, the percentage of the variation in the dependent variable y that is explained by the variation in the independent variable x is: 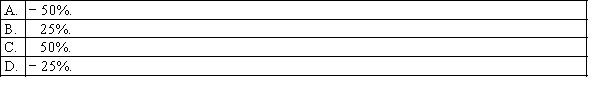
سؤال
In a simple linear regression, which of the following is equivalent to testing the significance of the population slope? 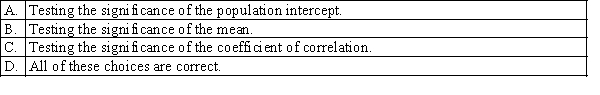
سؤال
The symbol for the sample coefficient of correlation is: 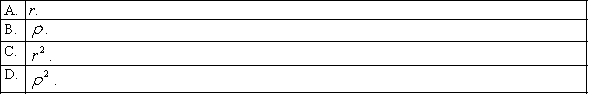
سؤال
Which value of the coefficient of correlation r indicates a stronger correlation than − 0.85? 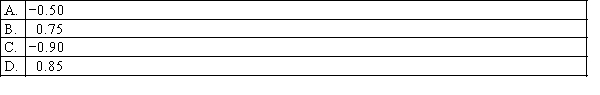
سؤال
A regression analysis between sales (in $1000) and advertising (in $100) yielded the least squares line  = 75 +6x. This implies that if $800 is spent on advertising, then the predicted amount of sales (in dollars) is:
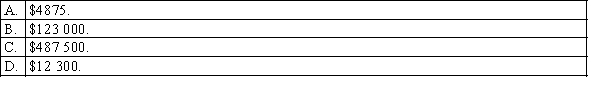
= 75 +6x. This implies that if $800 is spent on advertising, then the predicted amount of sales (in dollars) is: سؤال
The smallest value that the standard error of estimate  can assume is:
can assume is: سؤال
If all the points in a scatter diagram lie on the least squares regression line, then the coefficient of correlation must be: 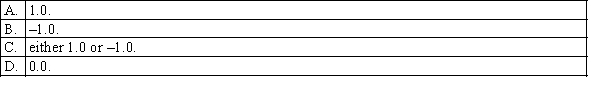
سؤال
Given the data points (x,y) = (3,3), (4,4), (5,5), (6,6), (7,7), the least squares estimates of the y-intercept and slope are respectively: 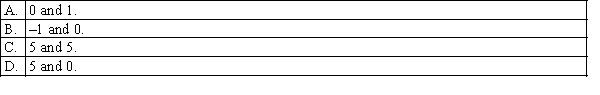
سؤال
Of the values of the coefficient of determination listed below, which one implies the greatest value of the sum of squares for regression, given that the total variation in y is 1800? 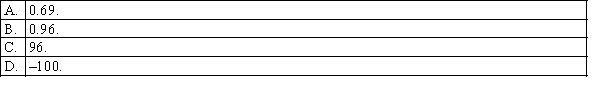
سؤال
When all the actual values of y and the predicted values of y are equal, the standard error of estimate will be: 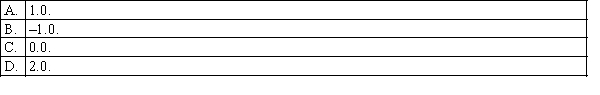
سؤال
In order to estimate with 95% confidence the expected value of y in a simple linear regression problem, a random sample of 10 observations is taken. Which of the following t-table values listed below would be used? 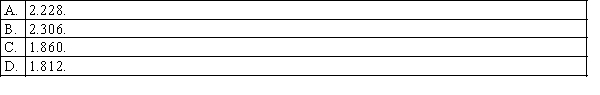
سؤال
A regression analysis between sales (in $1000) and advertising (in $) yielded the least squares line  = 80 000 + 5x. This implies that an:
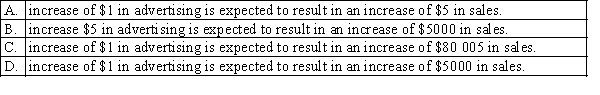
= 80 000 + 5x. This implies that an: سؤال
If the coefficient of correlation between x and y is close to −1.0, which of the following statements is correct? 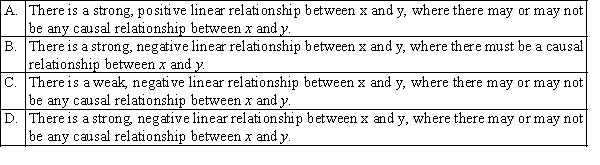
سؤال
Which of the following techniques is used to predict the value of one variable on the basis of other variables? 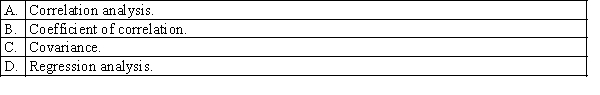
سؤال
In testing the hypotheses: 
 , the Spearman rank correlation coefficient in a sample of 50 observations is 0.389. The value of the test statistic is:
, the Spearman rank correlation coefficient in a sample of 50 observations is 0.389. The value of the test statistic is: سؤال
Which of the following statements best describes why a linear regression is also called a least squares regression model? 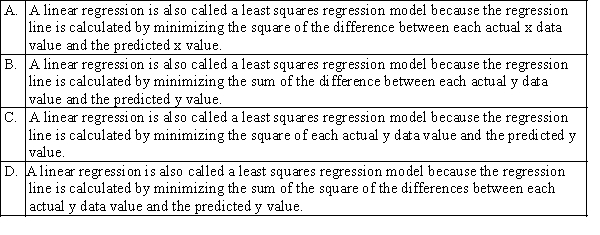
سؤال
If the standard error of estimate  = 15 and n = 12, then the sum of squares for error, SSE, is:
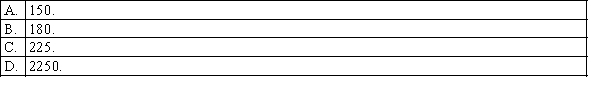
= 15 and n = 12, then the sum of squares for error, SSE, is: سؤال
A regression analysis between height y (in cm) and age x (in years) of 2 to 10 years old boys yielded the least squares line y-hat = 87 + 6.5x. This implies that by each additional year height is expected to: 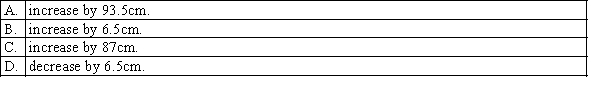
سؤال
Which of the following statistics and procedures can be used to determine whether a linear model should be employed? 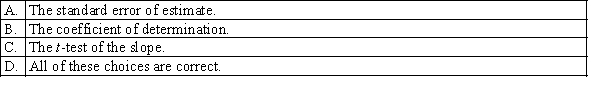
سؤال
In regression analysis, if the coefficient of correlation is -1.0, then: 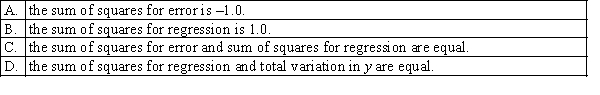
سؤال
The standardised residual is defined as: 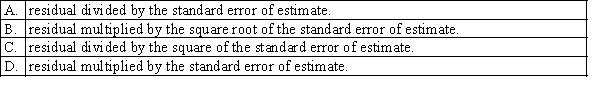
سؤال
If the coefficient of determination is 81%, and the linear regression model has a negative slope, what is the value of the coefficient of correlation? 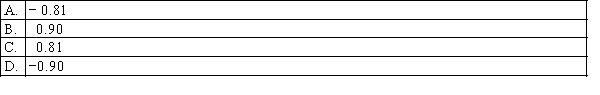
سؤال
Which of the following statements is correct when all the actual values of y are on an upward sloping regression line? 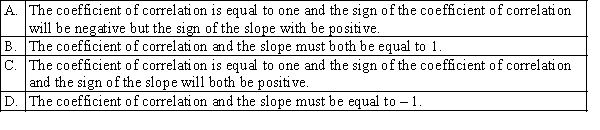
سؤال
The standard error of estimate,  , is given by:
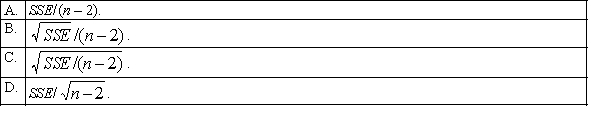
, is given by: سؤال
In regression analysis, the coefficient of determination,  , measures the amount of variation in y that is:
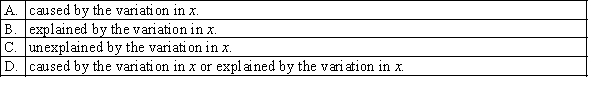
, measures the amount of variation in y that is: سؤال
سؤال
When the variance,  , of the error variable
  is a constant no matter what the value of x is, this condition is called:
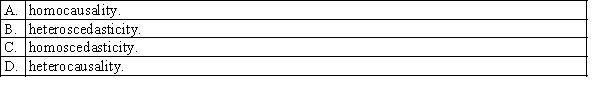
, of the error variable is a constant no matter what the value of x is, this condition is called: سؤال
The standard error of estimate,  , is a measure of:
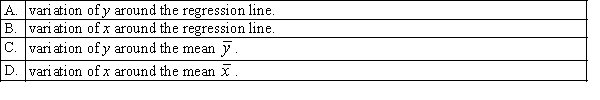
, is a measure of: سؤال
Which of the following statements best describes the slope in the simple linear regression model? 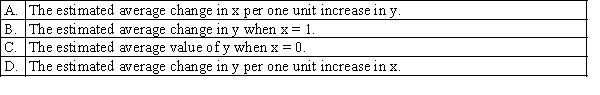
سؤال
Which of the following best describes the y-intercept in the simple linear regression model? 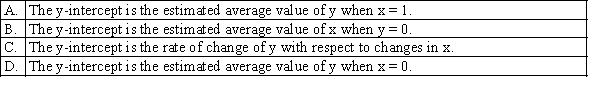
سؤال
Which of the following best describes if we want to test for a linear relationship between x and y, in regression analysis? 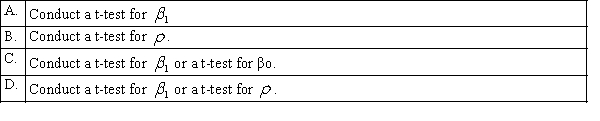
سؤال
In the first-order linear regression model, the population parameters of the y-intercept and the slope are: 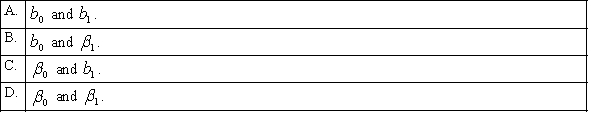
سؤال
In a regression problem the following pairs (x,y) are given: (1,2), (2.5,2), (3,2), (5,2) and (5.3,2). This indicates that the: 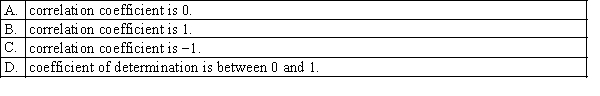
سؤال
Which of the following is not a required condition for the error variable  in the simple linear regression model?
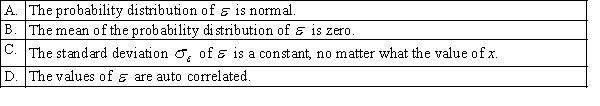
in the simple linear regression model? سؤال
In simple linear regression, the coefficient of correlation r and the least squares estimate  of the population slope
  :
: 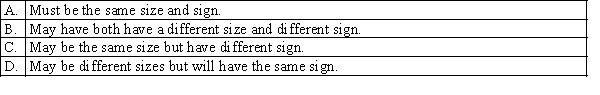
of the population slope : سؤال
When the sample size n is greater than 30, the Spearman rank correlation coefficient  is approximately normally distributed with:
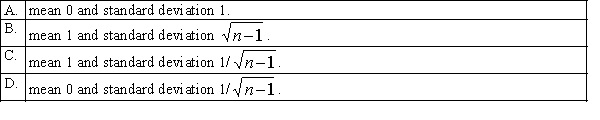
is approximately normally distributed with: سؤال
The least squares method requires that the variance  of the error variable
  is a constant no matter what the value of x is. When this requirement is violated, the condition is called:
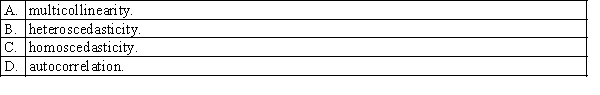
of the error variable is a constant no matter what the value of x is. When this requirement is violated, the condition is called: سؤال
In the first-order linear regression model, the population parameters of the y-intercept and the slope are estimated by: 
سؤال
Which of the following best describes the coefficient of determination? 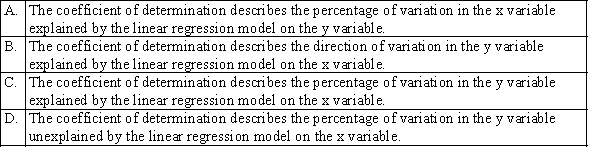
سؤال
In a regression problem, if the coefficient of determination is 0.95, this means that: 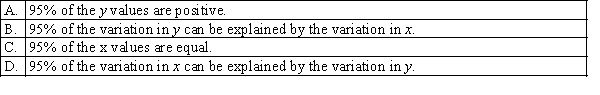
سؤال
Which of the following best describes the residuals in regression analysis? 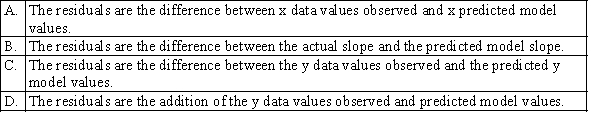
سؤال
If a simple linear regression model has no y-intercept, then: 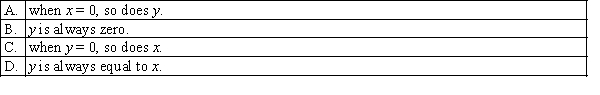
سؤال
In a simple linear regression problem, the following statistics are calculated from a sample of 10 observations: 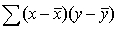 = 2250,
  = 10,
= 10,  = 50,
= 50,  = 75 The least squares estimates of the slope and y-intercept are respectively:
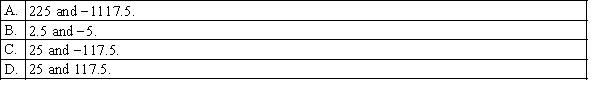
= 2250, = 10, = 50, = 75 The least squares estimates of the slope and y-intercept are respectively: سؤال
The Pearson coefficient of correlation r equals 1 when there is/are no: 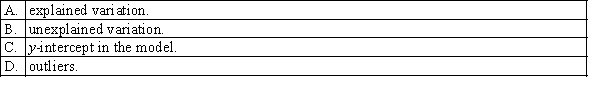
سؤال
سؤال
سؤال
سؤال
سؤال
سؤال
سؤال
When the actual values y of a dependent variable and the corresponding predicted values  are the same, the standard error of the estimate will be 1.0.
are the same, the standard error of the estimate will be 1.0. سؤال
If the sum of squared residuals is zero, then the: 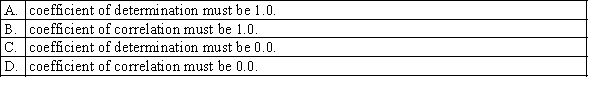
سؤال
The least squares method for determining the best fit minimises: 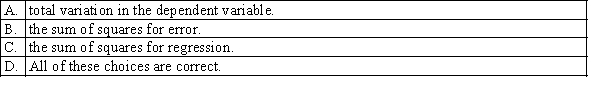
سؤال
سؤال
سؤال
In a regression problem, if all the values of the independent variable are equal, then the coefficient of determination must be: 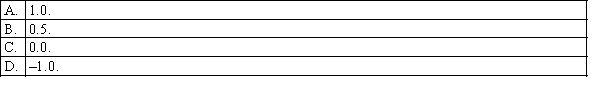
سؤال
سؤال
سؤال
سؤال
سؤال
سؤال
سؤال
When the actual values y of a dependent variable and the corresponding predicted values  are the same, the standard error of estimate, , will be 0.0.
are the same, the standard error of estimate, , will be 0.0. سؤال
In simple linear regression, which of the following statements indicates no linear relationship between the variables x and y? 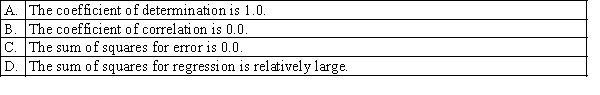

فتح الحزمة
قم بالتسجيل لفتح البطاقات في هذه المجموعة!
Unlock Deck
Unlock Deck
1/219
العب
ملء الشاشة (f)
Deck 18: Simple Linear Regression and Correlation
1
Which of the following best describes the relationship of the least squares regression line: Estimated y = 2 - x?
C
2
The regression line Estimated y = 3 + 2x has been fitted to the data points (4,8), (2,5), and (1,2). The sum of the squared residuals will be:
D
3
Which of the following statements best describes correlation analysis in a simple linear regression?
B
4
Given a specific value of x and confidence level, which of the following statements is correct?
فتح الحزمة
افتح القفل للوصول البطاقات البالغ عددها 219 في هذه المجموعة.
فتح الحزمة
k this deck
5
If an estimated regression line has a y-intercept of 10 and a slope of -5, then when x = 0, the estimated value of y is:
فتح الحزمة
افتح القفل للوصول البطاقات البالغ عددها 219 في هذه المجموعة.
فتح الحزمة
k this deck
6
Given that the sum of squares for error is 50 and the sum of squares for regression is 140, the coefficient of determination is:
فتح الحزمة
افتح القفل للوصول البطاقات البالغ عددها 219 في هذه المجموعة.
فتح الحزمة
k this deck
7
The Spearman rank correlation coefficient must be used to determine whether a relationship exists between two variables when:
فتح الحزمة
افتح القفل للوصول البطاقات البالغ عددها 219 في هذه المجموعة.
فتح الحزمة
k this deck
8
The symbol for the population coefficient of correlation is:
فتح الحزمة
افتح القفل للوصول البطاقات البالغ عددها 219 في هذه المجموعة.
فتح الحزمة
k this deck
9
If the coefficient of correlation is 0.80, the percentage of the variation in y that is explained by the variation in x is:
فتح الحزمة
افتح القفل للوصول البطاقات البالغ عددها 219 في هذه المجموعة.
فتح الحزمة
k this deck
10
In regression analysis, if the coefficient of determination is 1.0, then:
فتح الحزمة
افتح القفل للوصول البطاقات البالغ عددها 219 في هذه المجموعة.
فتح الحزمة
k this deck
11
Given the least squares regression line y-hat = 3.52 - 1.27x, and a coefficient of determination of 0.81, the coefficient of correlation is:
فتح الحزمة
افتح القفل للوصول البطاقات البالغ عددها 219 في هذه المجموعة.
فتح الحزمة
k this deck
12
A regression line using 25 observations produced SSR = 118.68 and SSE = 56.32. The standard error of estimate was:
فتح الحزمة
افتح القفل للوصول البطاقات البالغ عددها 219 في هذه المجموعة.
فتح الحزمة
k this deck
13
Given that ssx = 2500, ssy = 3750, ssxy = 500 and n = 6, the standard error of estimate is:
فتح الحزمة
افتح القفل للوصول البطاقات البالغ عددها 219 في هذه المجموعة.
فتح الحزمة
k this deck
14
The following sums of squares are produced: (yi-(y-bar))2 = 250, (yi-(yi-hat))2 = 100, ((yi-hat)-(y-bar))2 = 150
The percentage of the variation in y that is explained by the variation in x is:
The percentage of the variation in y that is explained by the variation in x is:
فتح الحزمة
افتح القفل للوصول البطاقات البالغ عددها 219 في هذه المجموعة.
فتح الحزمة
k this deck
15
Which of the following best describes the value of the slope, if the coefficient of determination is 0.95?
فتح الحزمة
افتح القفل للوصول البطاقات البالغ عددها 219 في هذه المجموعة.
فتح الحزمة
k this deck
16
In simple linear regression, most often we perform a two-tail test of the population slope to determine whether there is sufficient evidence to infer that a linear relationship exists. Which of the following best describes the null and alternative hypotheses needed for a test of significance?
to determine whether there is sufficient evidence to infer that a linear relationship exists. Which of the following best describes the null and alternative hypotheses needed for a test of significance? فتح الحزمة
افتح القفل للوصول البطاقات البالغ عددها 219 في هذه المجموعة.
فتح الحزمة
k this deck
17
If the coefficient of correlation is −0.50, the percentage of the variation in the dependent variable y that is explained by the variation in the independent variable x is:
فتح الحزمة
افتح القفل للوصول البطاقات البالغ عددها 219 في هذه المجموعة.
فتح الحزمة
k this deck
18
In a simple linear regression, which of the following is equivalent to testing the significance of the population slope?
فتح الحزمة
افتح القفل للوصول البطاقات البالغ عددها 219 في هذه المجموعة.
فتح الحزمة
k this deck
19
The symbol for the sample coefficient of correlation is:
فتح الحزمة
افتح القفل للوصول البطاقات البالغ عددها 219 في هذه المجموعة.
فتح الحزمة
k this deck
20
Which value of the coefficient of correlation r indicates a stronger correlation than − 0.85?
فتح الحزمة
افتح القفل للوصول البطاقات البالغ عددها 219 في هذه المجموعة.
فتح الحزمة
k this deck
21
A regression analysis between sales (in $1000) and advertising (in $100) yielded the least squares line = 75 +6x. This implies that if $800 is spent on advertising, then the predicted amount of sales (in dollars) is:
= 75 +6x. This implies that if $800 is spent on advertising, then the predicted amount of sales (in dollars) is: فتح الحزمة
افتح القفل للوصول البطاقات البالغ عددها 219 في هذه المجموعة.
فتح الحزمة
k this deck
22
The smallest value that the standard error of estimate can assume is:
can assume is: فتح الحزمة
افتح القفل للوصول البطاقات البالغ عددها 219 في هذه المجموعة.
فتح الحزمة
k this deck
23
If all the points in a scatter diagram lie on the least squares regression line, then the coefficient of correlation must be:
فتح الحزمة
افتح القفل للوصول البطاقات البالغ عددها 219 في هذه المجموعة.
فتح الحزمة
k this deck
24
Given the data points (x,y) = (3,3), (4,4), (5,5), (6,6), (7,7), the least squares estimates of the y-intercept and slope are respectively:
فتح الحزمة
افتح القفل للوصول البطاقات البالغ عددها 219 في هذه المجموعة.
فتح الحزمة
k this deck
25
Of the values of the coefficient of determination listed below, which one implies the greatest value of the sum of squares for regression, given that the total variation in y is 1800?
فتح الحزمة
افتح القفل للوصول البطاقات البالغ عددها 219 في هذه المجموعة.
فتح الحزمة
k this deck
26
When all the actual values of y and the predicted values of y are equal, the standard error of estimate will be:
فتح الحزمة
افتح القفل للوصول البطاقات البالغ عددها 219 في هذه المجموعة.
فتح الحزمة
k this deck
27
In order to estimate with 95% confidence the expected value of y in a simple linear regression problem, a random sample of 10 observations is taken. Which of the following t-table values listed below would be used?
فتح الحزمة
افتح القفل للوصول البطاقات البالغ عددها 219 في هذه المجموعة.
فتح الحزمة
k this deck
28
A regression analysis between sales (in $1000) and advertising (in $) yielded the least squares line = 80 000 + 5x. This implies that an:
= 80 000 + 5x. This implies that an: فتح الحزمة
افتح القفل للوصول البطاقات البالغ عددها 219 في هذه المجموعة.
فتح الحزمة
k this deck
29
If the coefficient of correlation between x and y is close to −1.0, which of the following statements is correct?
فتح الحزمة
افتح القفل للوصول البطاقات البالغ عددها 219 في هذه المجموعة.
فتح الحزمة
k this deck
30
Which of the following techniques is used to predict the value of one variable on the basis of other variables?
فتح الحزمة
افتح القفل للوصول البطاقات البالغ عددها 219 في هذه المجموعة.
فتح الحزمة
k this deck
31
In testing the hypotheses: , the Spearman rank correlation coefficient in a sample of 50 observations is 0.389. The value of the test statistic is:
, the Spearman rank correlation coefficient in a sample of 50 observations is 0.389. The value of the test statistic is: فتح الحزمة
افتح القفل للوصول البطاقات البالغ عددها 219 في هذه المجموعة.
فتح الحزمة
k this deck
32
Which of the following statements best describes why a linear regression is also called a least squares regression model?
فتح الحزمة
افتح القفل للوصول البطاقات البالغ عددها 219 في هذه المجموعة.
فتح الحزمة
k this deck
33
If the standard error of estimate = 15 and n = 12, then the sum of squares for error, SSE, is:
= 15 and n = 12, then the sum of squares for error, SSE, is: فتح الحزمة
افتح القفل للوصول البطاقات البالغ عددها 219 في هذه المجموعة.
فتح الحزمة
k this deck
34
A regression analysis between height y (in cm) and age x (in years) of 2 to 10 years old boys yielded the least squares line y-hat = 87 + 6.5x. This implies that by each additional year height is expected to:
فتح الحزمة
افتح القفل للوصول البطاقات البالغ عددها 219 في هذه المجموعة.
فتح الحزمة
k this deck
35
Which of the following statistics and procedures can be used to determine whether a linear model should be employed?
فتح الحزمة
افتح القفل للوصول البطاقات البالغ عددها 219 في هذه المجموعة.
فتح الحزمة
k this deck
36
In regression analysis, if the coefficient of correlation is -1.0, then:
فتح الحزمة
افتح القفل للوصول البطاقات البالغ عددها 219 في هذه المجموعة.
فتح الحزمة
k this deck
37
The standardised residual is defined as:
فتح الحزمة
افتح القفل للوصول البطاقات البالغ عددها 219 في هذه المجموعة.
فتح الحزمة
k this deck
38
If the coefficient of determination is 81%, and the linear regression model has a negative slope, what is the value of the coefficient of correlation?
فتح الحزمة
افتح القفل للوصول البطاقات البالغ عددها 219 في هذه المجموعة.
فتح الحزمة
k this deck
39
Which of the following statements is correct when all the actual values of y are on an upward sloping regression line?
فتح الحزمة
افتح القفل للوصول البطاقات البالغ عددها 219 في هذه المجموعة.
فتح الحزمة
k this deck
40
The standard error of estimate, , is given by:
, is given by: فتح الحزمة
افتح القفل للوصول البطاقات البالغ عددها 219 في هذه المجموعة.
فتح الحزمة
k this deck
41
In regression analysis, the coefficient of determination, , measures the amount of variation in y that is:
, measures the amount of variation in y that is: فتح الحزمة
افتح القفل للوصول البطاقات البالغ عددها 219 في هذه المجموعة.
فتح الحزمة
k this deck
42
If cov(X,Y) = -350, sx2 = 900 and sy2 = 225, then the coefficient of determination is:
فتح الحزمة
افتح القفل للوصول البطاقات البالغ عددها 219 في هذه المجموعة.
فتح الحزمة
k this deck
43
When the variance, , of the error variable is a constant no matter what the value of x is, this condition is called:
, of the error variable is a constant no matter what the value of x is, this condition is called: فتح الحزمة
افتح القفل للوصول البطاقات البالغ عددها 219 في هذه المجموعة.
فتح الحزمة
k this deck
44
The standard error of estimate, , is a measure of:
, is a measure of: فتح الحزمة
افتح القفل للوصول البطاقات البالغ عددها 219 في هذه المجموعة.
فتح الحزمة
k this deck
45
Which of the following statements best describes the slope in the simple linear regression model?
فتح الحزمة
افتح القفل للوصول البطاقات البالغ عددها 219 في هذه المجموعة.
فتح الحزمة
k this deck
46
Which of the following best describes the y-intercept in the simple linear regression model?
فتح الحزمة
افتح القفل للوصول البطاقات البالغ عددها 219 في هذه المجموعة.
فتح الحزمة
k this deck
47
Which of the following best describes if we want to test for a linear relationship between x and y, in regression analysis?
فتح الحزمة
افتح القفل للوصول البطاقات البالغ عددها 219 في هذه المجموعة.
فتح الحزمة
k this deck
48
In the first-order linear regression model, the population parameters of the y-intercept and the slope are:
فتح الحزمة
افتح القفل للوصول البطاقات البالغ عددها 219 في هذه المجموعة.
فتح الحزمة
k this deck
49
In a regression problem the following pairs (x,y) are given: (1,2), (2.5,2), (3,2), (5,2) and (5.3,2). This indicates that the:
فتح الحزمة
افتح القفل للوصول البطاقات البالغ عددها 219 في هذه المجموعة.
فتح الحزمة
k this deck
50
Which of the following is not a required condition for the error variable in the simple linear regression model?
in the simple linear regression model? فتح الحزمة
افتح القفل للوصول البطاقات البالغ عددها 219 في هذه المجموعة.
فتح الحزمة
k this deck
51
In simple linear regression, the coefficient of correlation r and the least squares estimate of the population slope :
of the population slope : فتح الحزمة
افتح القفل للوصول البطاقات البالغ عددها 219 في هذه المجموعة.
فتح الحزمة
k this deck
52
When the sample size n is greater than 30, the Spearman rank correlation coefficient is approximately normally distributed with:
is approximately normally distributed with: فتح الحزمة
افتح القفل للوصول البطاقات البالغ عددها 219 في هذه المجموعة.
فتح الحزمة
k this deck
53
The least squares method requires that the variance of the error variable is a constant no matter what the value of x is. When this requirement is violated, the condition is called:
of the error variable is a constant no matter what the value of x is. When this requirement is violated, the condition is called: فتح الحزمة
افتح القفل للوصول البطاقات البالغ عددها 219 في هذه المجموعة.
فتح الحزمة
k this deck
54
In the first-order linear regression model, the population parameters of the y-intercept and the slope are estimated by:
فتح الحزمة
افتح القفل للوصول البطاقات البالغ عددها 219 في هذه المجموعة.
فتح الحزمة
k this deck
55
Which of the following best describes the coefficient of determination?
فتح الحزمة
افتح القفل للوصول البطاقات البالغ عددها 219 في هذه المجموعة.
فتح الحزمة
k this deck
56
In a regression problem, if the coefficient of determination is 0.95, this means that:
فتح الحزمة
افتح القفل للوصول البطاقات البالغ عددها 219 في هذه المجموعة.
فتح الحزمة
k this deck
57
Which of the following best describes the residuals in regression analysis?
فتح الحزمة
افتح القفل للوصول البطاقات البالغ عددها 219 في هذه المجموعة.
فتح الحزمة
k this deck
58
If a simple linear regression model has no y-intercept, then:
فتح الحزمة
افتح القفل للوصول البطاقات البالغ عددها 219 في هذه المجموعة.
فتح الحزمة
k this deck
59
In a simple linear regression problem, the following statistics are calculated from a sample of 10 observations: = 2250, = 10, = 50, = 75 The least squares estimates of the slope and y-intercept are respectively:
= 2250, = 10, = 50, = 75 The least squares estimates of the slope and y-intercept are respectively: فتح الحزمة
افتح القفل للوصول البطاقات البالغ عددها 219 في هذه المجموعة.
فتح الحزمة
k this deck
60
The Pearson coefficient of correlation r equals 1 when there is/are no:
فتح الحزمة
افتح القفل للوصول البطاقات البالغ عددها 219 في هذه المجموعة.
فتح الحزمة
k this deck
61
The value of the sum of squares for regression, SSR, can never be smaller than 0.0.
فتح الحزمة
افتح القفل للوصول البطاقات البالغ عددها 219 في هذه المجموعة.
فتح الحزمة
k this deck
62
In developing a 90% confidence interval for the expected value of y from a simple linear regression problem involving a sample of size 15, the appropriate table value would be 1.761.
فتح الحزمة
افتح القفل للوصول البطاقات البالغ عددها 219 في هذه المجموعة.
فتح الحزمة
k this deck
63
Regardless of the value of x, the standard deviation of the distribution of y values about the regression line is supposed to be constant. This assumption of equal standard deviations about the regression line is called multicollinearity.
فتح الحزمة
افتح القفل للوصول البطاقات البالغ عددها 219 في هذه المجموعة.
فتح الحزمة
k this deck
64
The variance of the error variable, , is required to be constant. When this requirement is satisfied, the condition is called homoscedasticity.
فتح الحزمة
افتح القفل للوصول البطاقات البالغ عددها 219 في هذه المجموعة.
فتح الحزمة
k this deck
65
If all the values of an independent variable x are equal, then regressing a dependent variable y on x will result in a coefficient of determination of 100%.
فتح الحزمة
افتح القفل للوصول البطاقات البالغ عددها 219 في هذه المجموعة.
فتح الحزمة
k this deck
66
The method of least squares requires that the sum of the squared deviations between actual y values in the scatter diagram and y values predicted by the regression line be minimised.
فتح الحزمة
افتح القفل للوصول البطاقات البالغ عددها 219 في هذه المجموعة.
فتح الحزمة
k this deck
67
When the actual values y of a dependent variable and the corresponding predicted values are the same, the standard error of the estimate will be 1.0.
are the same, the standard error of the estimate will be 1.0. فتح الحزمة
افتح القفل للوصول البطاقات البالغ عددها 219 في هذه المجموعة.
فتح الحزمة
k this deck
68
If the sum of squared residuals is zero, then the:
فتح الحزمة
افتح القفل للوصول البطاقات البالغ عددها 219 في هذه المجموعة.
فتح الحزمة
k this deck
69
The least squares method for determining the best fit minimises:
فتح الحزمة
افتح القفل للوصول البطاقات البالغ عددها 219 في هذه المجموعة.
فتح الحزمة
k this deck
70
In a simple linear regression model, testing whether the slope, , of the population regression line is zero is the same as testing whether the population coefficient of correlation, , equals zero.
فتح الحزمة
افتح القفل للوصول البطاقات البالغ عددها 219 في هذه المجموعة.
فتح الحزمة
k this deck
71
The variance of the error variable, , is required to be constant. When this requirement is violated, the condition is called heteroscedasticity.
فتح الحزمة
افتح القفل للوصول البطاقات البالغ عددها 219 في هذه المجموعة.
فتح الحزمة
k this deck
72
In a regression problem, if all the values of the independent variable are equal, then the coefficient of determination must be:
فتح الحزمة
افتح القفل للوصول البطاقات البالغ عددها 219 في هذه المجموعة.
فتح الحزمة
k this deck
73
In developing a 95% confidence interval for the expected value of y from a simple linear regression problem involving a sample of size 10, the appropriate table value would be 2.306.
فتح الحزمة
افتح القفل للوصول البطاقات البالغ عددها 219 في هذه المجموعة.
فتح الحزمة
k this deck
74
The value of the sum of squares for regression, SSR, can never be smaller than 1.
فتح الحزمة
افتح القفل للوصول البطاقات البالغ عددها 219 في هذه المجموعة.
فتح الحزمة
k this deck
75
A direct relationship between an independent variable x and a dependent variably y means that x and y move in the same directions.
فتح الحزمة
افتح القفل للوصول البطاقات البالغ عددها 219 في هذه المجموعة.
فتح الحزمة
k this deck
76
A direct relationship between an independent variable x and a dependent variably y means that the variables x and y increase or decrease together.
فتح الحزمة
افتح القفل للوصول البطاقات البالغ عددها 219 في هذه المجموعة.
فتح الحزمة
k this deck
77
If the value of the sum of squares for error, SSE, equals zero, then the coefficient of determination must equal zero.
فتح الحزمة
افتح القفل للوصول البطاقات البالغ عددها 219 في هذه المجموعة.
فتح الحزمة
k this deck
78
On the least squares regression line Estimated y= 2 - 3x, the predicted value of y equals:
فتح الحزمة
افتح القفل للوصول البطاقات البالغ عددها 219 في هذه المجموعة.
فتح الحزمة
k this deck
79
When the actual values y of a dependent variable and the corresponding predicted values are the same, the standard error of estimate, , will be 0.0.
are the same, the standard error of estimate, , will be 0.0. فتح الحزمة
افتح القفل للوصول البطاقات البالغ عددها 219 في هذه المجموعة.
فتح الحزمة
k this deck
80
In simple linear regression, which of the following statements indicates no linear relationship between the variables x and y?
فتح الحزمة
افتح القفل للوصول البطاقات البالغ عددها 219 في هذه المجموعة.
فتح الحزمة
k this deck
فتح الحزمة
افتح القفل للوصول البطاقات البالغ عددها 219 في هذه المجموعة.


