Deck 14: Simple Linear Regression
ملء الشاشة (f)
سؤال
سؤال
In the following estimated regression equation  = b0 + b1x,
A) b1 is the slope.
B) b1 is the intercept.
C) b1x is the slope.
D) b1x is the intercept.
= b0 + b1x,A) b1 is the slope.
B) b1 is the intercept.
C) b1x is the slope.
D) b1x is the intercept.
سؤال
سؤال
سؤال
سؤال
سؤال
The model developed from sample data that has the form of  = b0 + b1x is known as the
A) regression equation.
B) correlation model.
C) estimated regression equation.
D) regression model.
= b0 + b1x is known as theA) regression equation.
B) correlation model.
C) estimated regression equation.
D) regression model.
سؤال
In regression analysis, the model in the form y =  +
+  x + ε is called the
A) regression equation.
B) correlation model.
C) estimated regression equation.
D) regression model
+ x + ε is called theA) regression equation.
B) correlation model.
C) estimated regression equation.
D) regression model
سؤال
سؤال
سؤال
A regression analysis between sales (y in $1000) and advertising (x in dollars) resulted in the following equation:  = 30,000 + 5x
The above equation implies that an
A) increase of $4 in advertising is associated with an increase of $5000 in sales.
B) increase of $1 in advertising is associated with an increase of $5 in sales.
C) increase of $1 in advertising is associated with an increase of $34,000 in sales.
D) increase of $1 in advertising is associated with an increase of $5000 in sales.
= 30,000 + 5x
The above equation implies that an
A) increase of $4 in advertising is associated with an increase of $5000 in sales.
B) increase of $1 in advertising is associated with an increase of $5 in sales.
C) increase of $1 in advertising is associated with an increase of $34,000 in sales.
D) increase of $1 in advertising is associated with an increase of $5000 in sales.
سؤال
سؤال
سؤال
In regression analysis, the error term ε is a random variable with a mean or expected value of
A) 0.
B) 1.
C) μ.
D) .
.
A) 0.
B) 1.
C) μ.
D)
. سؤال
سؤال
سؤال
سؤال
سؤال
سؤال
سؤال
سؤال
سؤال
سؤال
سؤال
سؤال
سؤال
سؤال
سؤال
سؤال
سؤال
سؤال
سؤال
سؤال
سؤال
Regression analysis was applied between demand for a product (y) and the price of the product (x), and the following estimated regression equation was obtained.  = 120 - 10x
Based on the above estimated regression equation, if price is increased by 3units, then demand is expected to
A) increase by 120 units.
B) decrease by 100 units.
C) increase by 30 units.
D) decease by 30 units.
= 120 - 10x
Based on the above estimated regression equation, if price is increased by 3units, then demand is expected to
A) increase by 120 units.
B) decrease by 100 units.
C) increase by 30 units.
D) decease by 30 units.
سؤال
سؤال
سؤال
سؤال
سؤال
سؤال
سؤال
سؤال
سؤال
سؤال
سؤال
A regression analysis between demand (y in 1000 units) and price (x in dollars) resulted in the following equation:  = 9 - 4x
The above equation implies that if the price is increased by $1, the demand is expected to
A) increase by 5 units.
B) decrease by 4 units.
C) decrease by 5000 units.
D) decrease by 4000 units.
= 9 - 4x
The above equation implies that if the price is increased by $1, the demand is expected to
A) increase by 5 units.
B) decrease by 4 units.
C) decrease by 5000 units.
D) decrease by 4000 units.
سؤال
سؤال
Regression analysis was applied between sales (in $10,000) and advertising (in $100) and the following regression function was obtained.  = 50 + 8x
Based on the above estimated regression line, if advertising is $1000, then the point estimate for sales (in dollars) is
A) $8050.
B) $130.
C) $130,000.
D) $1,300,000.
= 50 + 8x
Based on the above estimated regression line, if advertising is $1000, then the point estimate for sales (in dollars) is
A) $8050.
B) $130.
C) $130,000.
D) $1,300,000.
سؤال
سؤال
سؤال
A regression analysis between sales (in $1000) and price (in dollars) resulted in the following equation:  = 40 - 6x
The above equation implies that an
A) increase of $1 in price is associated with a decrease of $6 in sales.
B) increase of $8 in price is associated with a decrease of $24,000 in sales.
C) increase of $1 in price is associated with a decrease of $240 in sales.
D) increase of $1 in price is associated with a decrease of $6000 in sales.
= 40 - 6x
The above equation implies that an
A) increase of $1 in price is associated with a decrease of $6 in sales.
B) increase of $8 in price is associated with a decrease of $24,000 in sales.
C) increase of $1 in price is associated with a decrease of $240 in sales.
D) increase of $1 in price is associated with a decrease of $6000 in sales.
سؤال
سؤال
Regression analysis was applied between sales (in $1000) and advertising (in $100) and the following regression function was obtained.  = 500 + 4x
Based on the above estimated regression line, if advertising is $10,000, then the point estimate for sales (in dollars) is
A) $900.
B) $900,000.
C) $40,500.
D) $505,000.
= 500 + 4x
Based on the above estimated regression line, if advertising is $10,000, then the point estimate for sales (in dollars) is
A) $900.
B) $900,000.
C) $40,500.
D) $505,000.
سؤال
سؤال
سؤال
سؤال
سؤال
سؤال
سؤال
سؤال
Regression analysis was applied between sales data (y in $1000s) and advertising data (x in $100s) and the following information was obtained.  = 12 + 1.8x
N = 17
SSR = 225
SSE = 75
Sb1 = .2683
The t statistic for testing the significance of the slope is
A) 1.80.
B) 1.96.
C) 6.71.
D) .56.
= 12 + 1.8x
N = 17
SSR = 225
SSE = 75
Sb1 = .2683
The t statistic for testing the significance of the slope is
A) 1.80.
B) 1.96.
C) 6.71.
D) .56.
سؤال
Regression analysis was applied between sales (y in $1000) and advertising (x in $100) and the following estimated regression equation was obtained.  = 80 + 6.2x
Based on the above estimated regression line, if advertising is $10,000, then the point estimate for sales (in dollars) is
A) $62,080.
B) $142,000.
C) $700.
D) $700,000.
= 80 + 6.2x
Based on the above estimated regression line, if advertising is $10,000, then the point estimate for sales (in dollars) is
A) $62,080.
B) $142,000.
C) $700.
D) $700,000.
سؤال
You are given the following information about y and x.  The least squares estimate of the slope or b1 equals
A) 1.
B) -1.
C) -10.75.
D) 10.75.
The least squares estimate of the slope or b1 equalsA) 1.
B) -1.
C) -10.75.
D) 10.75.
سؤال
You are given the following information about y and x. 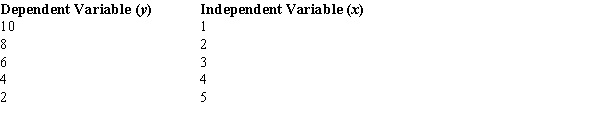 The sample correlation coefficient equals
A) 0.
B) +1.
C) -1.
D) -.5.
The sample correlation coefficient equalsA) 0.
B) +1.
C) -1.
D) -.5.
سؤال
The following information regarding a dependent variable (y) and an independent variable (x) is provided. 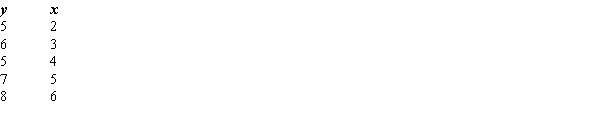
SSE = 1.9
SST = 6.8
The least squares estimate of the slope is
A) 1.
B) 3.4.
C) 3.
D) .7.
SSE = 1.9
SST = 6.8
The least squares estimate of the slope is
A) 1.
B) 3.4.
C) 3.
D) .7.
سؤال
You are given the following information about y and x. 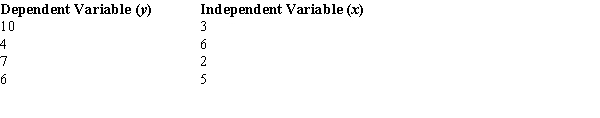 The sample correlation coefficient equals
A) -.7303.
B) .7303.
C) -.5333.
D) .5333.
The sample correlation coefficient equalsA) -.7303.
B) .7303.
C) -.5333.
D) .5333.
سؤال
The following information regarding a dependent variable (y) and an independent variable (x) is provided.  SSE = 1.9
SST = 6.8
The least squares estimate of the y-intercept is
A) 1.
B) 3.4.
C) 3.
D) 4.7.
SSE = 1.9SST = 6.8
The least squares estimate of the y-intercept is
A) 1.
B) 3.4.
C) 3.
D) 4.7.
سؤال
سؤال
The following information regarding a dependent variable (y) and an independent variable (x) is provided.  SSE = 1.9
SST = 6.8
The MSE is
A) 4.9.
B) .63.
C) 6.8.
D) 1.9.
SSE = 1.9SST = 6.8
The MSE is
A) 4.9.
B) .63.
C) 6.8.
D) 1.9.
سؤال
You are given the following information about y and x.  The point estimate of y when x = 2 is
A) -10.
B) 10.
C) -8.
D) 8.
The point estimate of y when x = 2 isA) -10.
B) 10.
C) -8.
D) 8.
سؤال
Regression analysis was applied between sales data (y in $1000s) and advertising data (x in $100s) and the following information was obtained.  = 12 + 1.8x
N = 17
SSR = 225
SSE = 75
Sb1 = .2683
To perform an F test, the p-value is
A) less than .01.
B) between .01 and .025.
C) between .025 and .05.
D) greater than .10.
= 12 + 1.8x
N = 17
SSR = 225
SSE = 75
Sb1 = .2683
To perform an F test, the p-value is
A) less than .01.
B) between .01 and .025.
C) between .025 and .05.
D) greater than .10.
سؤال
The following information regarding a dependent variable (y) and an independent variable (x) is provided.  SSE = 1.9
SST = 6.8
The coefficient of determination is
A) .8489.
B) -.7206.
C) .7206.
D) .375.
SSE = 1.9SST = 6.8
The coefficient of determination is
A) .8489.
B) -.7206.
C) .7206.
D) .375.
سؤال
You are given the following information about y and x. 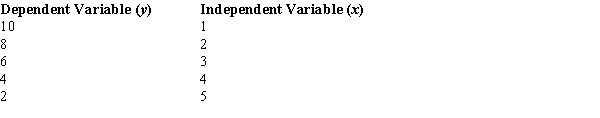 The least squares estimate of the slope or b1 equals
A) 1.
B) -2.
C) 3.
D) 12.
The least squares estimate of the slope or b1 equalsA) 1.
B) -2.
C) 3.
D) 12.
سؤال
Regression analysis was applied between sales data (y in $1000s) and advertising data (x in $100s) and the following information was obtained.  = 12 + 1.8x
N = 17
SSR = 225
SSE = 75
Sb1 = .2683
Based on the above estimated regression equation, if advertising is $3000, then the point estimate for sales (in dollars) is
A) $66,000.
B) $5412.
C) $66.
D) $17,400.
= 12 + 1.8x
N = 17
SSR = 225
SSE = 75
Sb1 = .2683
Based on the above estimated regression equation, if advertising is $3000, then the point estimate for sales (in dollars) is
A) $66,000.
B) $5412.
C) $66.
D) $17,400.
سؤال
Regression analysis was applied between sales data (y in $1000s) and advertising data (x in $100s) and the following information was obtained.  = 12 + 1.8x
N = 17
SSR = 225
SSE = 75
Sb1 = .2683
The F statistic computed from the above data is
A) 3.
B) 45.
C) 48.
D) 50.
= 12 + 1.8x
N = 17
SSR = 225
SSE = 75
Sb1 = .2683
The F statistic computed from the above data is
A) 3.
B) 45.
C) 48.
D) 50.
سؤال
You are given the following information about y and x.  The coefficient of determination equals
A) 0.
B) -1.
C) +1.
D) -.5.
The coefficient of determination equalsA) 0.
B) -1.
C) +1.
D) -.5.
سؤال
The following information regarding a dependent variable (y) and an independent variable (x) is provided.  SSE = 1.9
SST = 6.8
The coefficient of correlation is
A) .8489.
B) -.7206.
C) .7206.
D) .375.
SSE = 1.9SST = 6.8
The coefficient of correlation is
A) .8489.
B) -.7206.
C) .7206.
D) .375.
سؤال
You are given the following information about y and x. 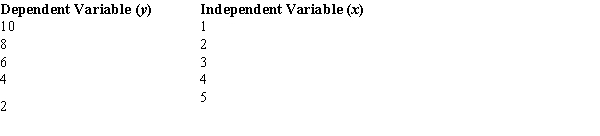
The least squares estimate of the intercept or b0 equals
A) 1.
B) -2.
C) 12.
D) 4.
The least squares estimate of the intercept or b0 equals
A) 1.
B) -2.
C) 12.
D) 4.
سؤال
You are given the following information about y and x. 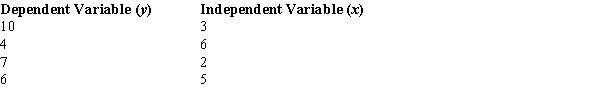 The coefficient of determination equals
A) -.7303.
B) .7303.
C) -.5333.
D) .5333.
The coefficient of determination equalsA) -.7303.
B) .7303.
C) -.5333.
D) .5333.
سؤال
You are given the following information about y and x.  The least squares estimate of the intercept or b0 equals
A) 1.
B) -1.
C) -10.75.
D) 10.75.
The least squares estimate of the intercept or b0 equalsA) 1.
B) -1.
C) -10.75.
D) 10.75.

فتح الحزمة
قم بالتسجيل لفتح البطاقات في هذه المجموعة!
Unlock Deck
Unlock Deck
1/132
العب
ملء الشاشة (f)
Deck 14: Simple Linear Regression
1
The standard error of the estimate is the
A) standard deviation of t.
B) square root of SSE.
C) square root of SST.
D) square root of MSE.
A) standard deviation of t.
B) square root of SSE.
C) square root of SST.
D) square root of MSE.
square root of MSE.
2
In the following estimated regression equation = b0 + b1x,
A) b1 is the slope.
B) b1 is the intercept.
C) b1x is the slope.
D) b1x is the intercept.
= b0 + b1x,A) b1 is the slope.
B) b1 is the intercept.
C) b1x is the slope.
D) b1x is the intercept.
b1 is the slope.
3
In a regression analysis, the standard error of the estimate is determined to be 4. In this situation, the MSE
A) is 2.
B) is 16.
C) depends on the sample size.
D) requires a known SSE.
A) is 2.
B) is 16.
C) depends on the sample size.
D) requires a known SSE.
is 16.
4
The value of the coefficient of correlation (r)
A) can be equal to the value of the coefficient of determination (r2).
B) can never be equal to the value of the coefficient of determination (r2).
C) is always smaller than the value of the coefficient of determination (r2).
D) is always larger than the value of the coefficient of determination (r2).
فتح الحزمة
افتح القفل للوصول البطاقات البالغ عددها 132 في هذه المجموعة.
فتح الحزمة
k this deck
5
The interval estimate of an individual value of y for a given value of x is the
A) prediction interval estimate.
B) confidence interval estimate.
C) average regression interval.
D) x versus y correlation interval.
A) prediction interval estimate.
B) confidence interval estimate.
C) average regression interval.
D) x versus y correlation interval.
فتح الحزمة
افتح القفل للوصول البطاقات البالغ عددها 132 في هذه المجموعة.
فتح الحزمة
k this deck
6
The coefficient of determination
A) cannot be negative.
B) is the square root of the coefficient of correlation.
C) is the same as the coefficient of correlation.
D) can be negative or positive.
A) cannot be negative.
B) is the square root of the coefficient of correlation.
C) is the same as the coefficient of correlation.
D) can be negative or positive.
فتح الحزمة
افتح القفل للوصول البطاقات البالغ عددها 132 في هذه المجموعة.
فتح الحزمة
k this deck
7
The model developed from sample data that has the form of = b0 + b1x is known as the
A) regression equation.
B) correlation model.
C) estimated regression equation.
D) regression model.
= b0 + b1x is known as theA) regression equation.
B) correlation model.
C) estimated regression equation.
D) regression model.
فتح الحزمة
افتح القفل للوصول البطاقات البالغ عددها 132 في هذه المجموعة.
فتح الحزمة
k this deck
8
In regression analysis, the model in the form y = + x + ε is called the
A) regression equation.
B) correlation model.
C) estimated regression equation.
D) regression model
+ x + ε is called theA) regression equation.
B) correlation model.
C) estimated regression equation.
D) regression model
فتح الحزمة
افتح القفل للوصول البطاقات البالغ عددها 132 في هذه المجموعة.
فتح الحزمة
k this deck
9
The coefficient of correlation
A) is the square of the r-square.
B) is the square root of the r-square.
C) can never be equal to r-square.
D) can never be negative.
A) is the square of the r-square.
B) is the square root of the r-square.
C) can never be equal to r-square.
D) can never be negative.
فتح الحزمة
افتح القفل للوصول البطاقات البالغ عددها 132 في هذه المجموعة.
فتح الحزمة
k this deck
10
The interval estimate of the mean value of y for a given value of x is the
A) prediction interval estimate.
B) confidence interval estimate.
C) average regression interval.
D) x versus y correlation interval.
A) prediction interval estimate.
B) confidence interval estimate.
C) average regression interval.
D) x versus y correlation interval.
فتح الحزمة
افتح القفل للوصول البطاقات البالغ عددها 132 في هذه المجموعة.
فتح الحزمة
k this deck
11
A regression analysis between sales (y in $1000) and advertising (x in dollars) resulted in the following equation: = 30,000 + 5x
The above equation implies that an
A) increase of $4 in advertising is associated with an increase of $5000 in sales.
B) increase of $1 in advertising is associated with an increase of $5 in sales.
C) increase of $1 in advertising is associated with an increase of $34,000 in sales.
D) increase of $1 in advertising is associated with an increase of $5000 in sales.
= 30,000 + 5x
The above equation implies that an
A) increase of $4 in advertising is associated with an increase of $5000 in sales.
B) increase of $1 in advertising is associated with an increase of $5 in sales.
C) increase of $1 in advertising is associated with an increase of $34,000 in sales.
D) increase of $1 in advertising is associated with an increase of $5000 in sales.
فتح الحزمة
افتح القفل للوصول البطاقات البالغ عددها 132 في هذه المجموعة.
فتح الحزمة
k this deck
12
In regression analysis, which of the following assumptions is not true about the error term ε?
A) The expected value of the error term is one.
B) The variance of the error term is the same for all values of x.
C) The values of the error term are independent.
D) The error term is normally distributed.
A) The expected value of the error term is one.
B) The variance of the error term is the same for all values of x.
C) The values of the error term are independent.
D) The error term is normally distributed.
فتح الحزمة
افتح القفل للوصول البطاقات البالغ عددها 132 في هذه المجموعة.
فتح الحزمة
k this deck
13
The proportion of the variation in the dependent variable y that is explained by the estimated regression equation is measured by the
A) correlation coefficient.
B) standard error of the estimate.
C) coefficient of determination.
D) confidence interval estimate.
A) correlation coefficient.
B) standard error of the estimate.
C) coefficient of determination.
D) confidence interval estimate.
فتح الحزمة
افتح القفل للوصول البطاقات البالغ عددها 132 في هذه المجموعة.
فتح الحزمة
k this deck
14
In regression analysis, the error term ε is a random variable with a mean or expected value of
A) 0.
B) 1.
C) μ.
D) .
A) 0.
B) 1.
C) μ.
D)
. فتح الحزمة
افتح القفل للوصول البطاقات البالغ عددها 132 في هذه المجموعة.
فتح الحزمة
k this deck
15
Regression analysis is a statistical procedure for developing a mathematical equation that describes how
A) one independent and one or more dependent variables are related.
B) several independent and several dependent variables are related.
C) one dependent and one or more independent variables are related.
D) one dependent, one independent, and several error variables are related.
A) one independent and one or more dependent variables are related.
B) several independent and several dependent variables are related.
C) one dependent and one or more independent variables are related.
D) one dependent, one independent, and several error variables are related.
فتح الحزمة
افتح القفل للوصول البطاقات البالغ عددها 132 في هذه المجموعة.
فتح الحزمة
k this deck
16
If only MSE is known, you can compute the
A) r-square.
B) coefficient of correlation.
C) standard error.
D) ith residual.
A) r-square.
B) coefficient of correlation.
C) standard error.
D) ith residual.
فتح الحزمة
افتح القفل للوصول البطاقات البالغ عددها 132 في هذه المجموعة.
فتح الحزمة
k this deck
17
In simple linear regression, r2 is the
A) mean square error.
B) correlation coefficient.
C) squared residual.
D) coefficient of determination.
A) mean square error.
B) correlation coefficient.
C) squared residual.
D) coefficient of determination.
فتح الحزمة
افتح القفل للوصول البطاقات البالغ عددها 132 في هذه المجموعة.
فتح الحزمة
k this deck
18
The mathematical equation relating the independent variable to the expected value of the dependent variable; that is, E(y) = β0 + β1x, is known as the
A) regression equation.
B) correlation model.
C) estimated regression equation.
D) regression model.
A) regression equation.
B) correlation model.
C) estimated regression equation.
D) regression model.
فتح الحزمة
افتح القفل للوصول البطاقات البالغ عددها 132 في هذه المجموعة.
فتح الحزمة
k this deck
19
If the coefficient of determination is a positive value, then the coefficient of correlation
A) must also be positive.
B) must be zero.
C) can be either positive or negative.
D) can be larger than 1.
A) must also be positive.
B) must be zero.
C) can be either positive or negative.
D) can be larger than 1.
فتح الحزمة
افتح القفل للوصول البطاقات البالغ عددها 132 في هذه المجموعة.
فتح الحزمة
k this deck
20
In regression analysis, the unbiased estimate of the variance is
A) coefficient of correlation.
B) coefficient of determination.
C) mean square error.
D) slope of the regression equation.
A) coefficient of correlation.
B) coefficient of determination.
C) mean square error.
D) slope of the regression equation.
فتح الحزمة
افتح القفل للوصول البطاقات البالغ عددها 132 في هذه المجموعة.
فتح الحزمة
k this deck
21
In regression analysis, the independent variable is
A) used to predict other independent variables.
B) used to predict the dependent variable.
C) the variable that is not used for prediction.
D) the variable that is being predicted.
A) used to predict other independent variables.
B) used to predict the dependent variable.
C) the variable that is not used for prediction.
D) the variable that is being predicted.
فتح الحزمة
افتح القفل للوصول البطاقات البالغ عددها 132 في هذه المجموعة.
فتح الحزمة
k this deck
22
If the coefficient of determination is equal to 1, then the coefficient of correlation
A) must also be +1.
B) can be either -1 or +1.
C) can be any value between -1 to +1.
D) must be -1.
A) must also be +1.
B) can be either -1 or +1.
C) can be any value between -1 to +1.
D) must be -1.
فتح الحزمة
افتح القفل للوصول البطاقات البالغ عددها 132 في هذه المجموعة.
فتح الحزمة
k this deck
23
In a regression analysis, the coefficient of determination is .4225. The coefficient of correlation in this situation is
A) -.65 if b1 is negative.
B) .1785.
C) .18 if b1 is positive.
D) .4225.
A) -.65 if b1 is negative.
B) .1785.
C) .18 if b1 is positive.
D) .4225.
فتح الحزمة
افتح القفل للوصول البطاقات البالغ عددها 132 في هذه المجموعة.
فتح الحزمة
k this deck
24
In simple linear regression analysis, which of the following is not true?
A) The F test and the t test yield the same conclusion.
B) The F test and the t test may or may not yield the same conclusion.
C) The relationship between x and y is represented by a straight line.
D) The value of F = t2.
A) The F test and the t test yield the same conclusion.
B) The F test and the t test may or may not yield the same conclusion.
C) The relationship between x and y is represented by a straight line.
D) The value of F = t2.
فتح الحزمة
افتح القفل للوصول البطاقات البالغ عددها 132 في هذه المجموعة.
فتح الحزمة
k this deck
25
In a regression and correlation analysis, if r2 = 1, then
A) SSE = SST.
B) SSE = 1.
C) SSR = SSE.
D) SSR = SST.
A) SSE = SST.
B) SSE = 1.
C) SSR = SSE.
D) SSR = SST.
فتح الحزمة
افتح القفل للوصول البطاقات البالغ عددها 132 في هذه المجموعة.
فتح الحزمة
k this deck
26
If there is a very weak correlation between two variables, then the coefficient of determination must be
A) much larger than 1, if the correlation is positive.
B) much smaller than -1, if the correlation is negative.
C) equal to one.
D) closer or equal to zero.
A) much larger than 1, if the correlation is positive.
B) much smaller than -1, if the correlation is negative.
C) equal to one.
D) closer or equal to zero.
فتح الحزمة
افتح القفل للوصول البطاقات البالغ عددها 132 في هذه المجموعة.
فتح الحزمة
k this deck
27
In a regression analysis, if SSE = 200 and SSR = 400, then the coefficient of determination is
A) .67.
B) .50.
C) .40.
D) .20.
A) .67.
B) .50.
C) .40.
D) .20.
فتح الحزمة
افتح القفل للوصول البطاقات البالغ عددها 132 في هذه المجموعة.
فتح الحزمة
k this deck
28
In a regression and correlation analysis, if r2 = 1, then
A) SSE must also be equal to one.
B) SSE must be equal to zero.
C) SSE can be any positive value.
D) SSE must be negative.
A) SSE must also be equal to one.
B) SSE must be equal to zero.
C) SSE can be any positive value.
D) SSE must be negative.
فتح الحزمة
افتح القفل للوصول البطاقات البالغ عددها 132 في هذه المجموعة.
فتح الحزمة
k this deck
29
If the coefficient of correlation is .8, the percentage of variation in the dependent variable explained by the variation in the independent variable is
A) .85%.
B) 85%.
C) .7225%.
D) 72.25%.
A) .85%.
B) 85%.
C) .7225%.
D) 72.25%.
فتح الحزمة
افتح القفل للوصول البطاقات البالغ عددها 132 في هذه المجموعة.
فتح الحزمة
k this deck
30
In a regression analysis, the regression equation is given by y = 12 - 6x. If SSE = 510 and SST = 1000, then the coefficient of correlation is
A) -.7.
B) +.7.
C) .49.
D) -.49.
A) -.7.
B) +.7.
C) .49.
D) -.49.
فتح الحزمة
افتح القفل للوصول البطاقات البالغ عددها 132 في هذه المجموعة.
فتح الحزمة
k this deck
31
?Which of the following is correct?
A) ?SSE = SSR +SST
B) ?SSR = SSE + SST
C) ?SST = SSR +SSE
D) ?SST = SSR - SSE
A) ?SSE = SSR +SST
B) ?SSR = SSE + SST
C) ?SST = SSR +SSE
D) ?SST = SSR - SSE
فتح الحزمة
افتح القفل للوصول البطاقات البالغ عددها 132 في هذه المجموعة.
فتح الحزمة
k this deck
32
In regression analysis, the variable that is being predicted is the
A) dependent variable.
B) independent variable.
C) intercept variable.
D) error variable.
A) dependent variable.
B) independent variable.
C) intercept variable.
D) error variable.
فتح الحزمة
افتح القفل للوصول البطاقات البالغ عددها 132 في هذه المجموعة.
فتح الحزمة
k this deck
33
In regression and correlation analysis, if SSE and SST are known, then with this information the
A) coefficient of determination can be computed.
B) slope of the regression line can be computed.
C) y-intercept can be computed.
D) x-intercept can be computed.
A) coefficient of determination can be computed.
B) slope of the regression line can be computed.
C) y-intercept can be computed.
D) x-intercept can be computed.
فتح الحزمة
افتح القفل للوصول البطاقات البالغ عددها 132 في هذه المجموعة.
فتح الحزمة
k this deck
34
In regression analysis, if the independent variable is measured in pounds, the dependent variable
A) must also be in pounds.
B) must be in some unit of weight.
C) cannot be in pounds.
D) can be measured in any units.
A) must also be in pounds.
B) must be in some unit of weight.
C) cannot be in pounds.
D) can be measured in any units.
فتح الحزمة
افتح القفل للوصول البطاقات البالغ عددها 132 في هذه المجموعة.
فتح الحزمة
k this deck
35
Regression analysis was applied between demand for a product (y) and the price of the product (x), and the following estimated regression equation was obtained. = 120 - 10x
Based on the above estimated regression equation, if price is increased by 3units, then demand is expected to
A) increase by 120 units.
B) decrease by 100 units.
C) increase by 30 units.
D) decease by 30 units.
= 120 - 10x
Based on the above estimated regression equation, if price is increased by 3units, then demand is expected to
A) increase by 120 units.
B) decrease by 100 units.
C) increase by 30 units.
D) decease by 30 units.
فتح الحزمة
افتح القفل للوصول البطاقات البالغ عددها 132 في هذه المجموعة.
فتح الحزمة
k this deck
36
In a regression analysis, the coefficient of correlation is .15. The coefficient of determination in this situation is
A) .3873.
B) .0225.
C) 4.00.
D) 2.56.
A) .3873.
B) .0225.
C) 4.00.
D) 2.56.
فتح الحزمة
افتح القفل للوصول البطاقات البالغ عددها 132 في هذه المجموعة.
فتح الحزمة
k this deck
37
Correlation analysis is used to determine
A) the equation of the regression line.
B) the strength of the linear relationship between the dependent and the independent variables.
C) a specific value of the dependent variable for a given value of the independent variable.
D) a cause-and-effect relationship between the dependent and the independent variables.
فتح الحزمة
افتح القفل للوصول البطاقات البالغ عددها 132 في هذه المجموعة.
فتح الحزمة
k this deck
38
Larger values of r2 imply that the observations are more closely grouped about the
A) average value of the independent variables.
B) average value of the dependent variable.
C) least squares line.
D) origin.
A) average value of the independent variables.
B) average value of the dependent variable.
C) least squares line.
D) origin.
فتح الحزمة
افتح القفل للوصول البطاقات البالغ عددها 132 في هذه المجموعة.
فتح الحزمة
k this deck
39
The equation that describes how the dependent variable (y) is related to the independent variable (x) is called
A) the correlation model.
B) the regression model.
C) correlation analysis.
D) estimation analysis.
A) the correlation model.
B) the regression model.
C) correlation analysis.
D) estimation analysis.
فتح الحزمة
افتح القفل للوصول البطاقات البالغ عددها 132 في هذه المجموعة.
فتح الحزمة
k this deck
40
In a simple linear regression analysis (where y is a dependent and x an independent variable), if the y-intercept is positive, then
A) there is a positive correlation between x and y.
B) if x is increased, y must also increase.
C) if y is increased, x must also increase.
D) the estimated regression line intercepts the positive y-axis.
A) there is a positive correlation between x and y.
B) if x is increased, y must also increase.
C) if y is increased, x must also increase.
D) the estimated regression line intercepts the positive y-axis.
فتح الحزمة
افتح القفل للوصول البطاقات البالغ عددها 132 في هذه المجموعة.
فتح الحزمة
k this deck
41
Compared to the confidence interval estimate for a particular value of y in a linear regression model, the interval estimate for an average value of y will be
A) narrower.
B) wider.
C) the same.
D) easy to determine.
A) narrower.
B) wider.
C) the same.
D) easy to determine.
فتح الحزمة
افتح القفل للوصول البطاقات البالغ عددها 132 في هذه المجموعة.
فتح الحزمة
k this deck
42
If the coefficient of correlation is .4, then the slope of the regression line
A) must also be .4.
B) can be either negative or positive.
C) must be positive.
D) must be .16.
A) must also be .4.
B) can be either negative or positive.
C) must be positive.
D) must be .16.
فتح الحزمة
افتح القفل للوصول البطاقات البالغ عددها 132 في هذه المجموعة.
فتح الحزمة
k this deck
43
If the coefficient of correlation is a negative value, then the coefficient of determination
A) must also be negative.
B) must be zero.
C) can be either negative or positive.
D) will be positive.
A) must also be negative.
B) must be zero.
C) can be either negative or positive.
D) will be positive.
فتح الحزمة
افتح القفل للوصول البطاقات البالغ عددها 132 في هذه المجموعة.
فتح الحزمة
k this deck
44
It is possible for the coefficient of determination to be
A) larger than 1.
B) less than 1.
C) less than -1.
D) equal to -1.
A) larger than 1.
B) less than 1.
C) less than -1.
D) equal to -1.
فتح الحزمة
افتح القفل للوصول البطاقات البالغ عددها 132 في هذه المجموعة.
فتح الحزمة
k this deck
45
SSE can never be
A) larger than SST.
B) smaller than SST.
C) equal to one.
D) equal to zero.
A) larger than SST.
B) smaller than SST.
C) equal to one.
D) equal to zero.
فتح الحزمة
افتح القفل للوصول البطاقات البالغ عددها 132 في هذه المجموعة.
فتح الحزمة
k this deck
46
A regression analysis between demand (y in 1000 units) and price (x in dollars) resulted in the following equation: = 9 - 4x
The above equation implies that if the price is increased by $1, the demand is expected to
A) increase by 5 units.
B) decrease by 4 units.
C) decrease by 5000 units.
D) decrease by 4000 units.
= 9 - 4x
The above equation implies that if the price is increased by $1, the demand is expected to
A) increase by 5 units.
B) decrease by 4 units.
C) decrease by 5000 units.
D) decrease by 4000 units.
فتح الحزمة
افتح القفل للوصول البطاقات البالغ عددها 132 في هذه المجموعة.
فتح الحزمة
k this deck
47
In a regression analysis, if SST = 500 and SSE = 200, then the coefficient of determination is
A) .20.
B) .67.
C) .60.
D) .40.
A) .20.
B) .67.
C) .60.
D) .40.
فتح الحزمة
افتح القفل للوصول البطاقات البالغ عددها 132 في هذه المجموعة.
فتح الحزمة
k this deck
48
Regression analysis was applied between sales (in $10,000) and advertising (in $100) and the following regression function was obtained. = 50 + 8x
Based on the above estimated regression line, if advertising is $1000, then the point estimate for sales (in dollars) is
A) $8050.
B) $130.
C) $130,000.
D) $1,300,000.
= 50 + 8x
Based on the above estimated regression line, if advertising is $1000, then the point estimate for sales (in dollars) is
A) $8050.
B) $130.
C) $130,000.
D) $1,300,000.
فتح الحزمة
افتح القفل للوصول البطاقات البالغ عددها 132 في هذه المجموعة.
فتح الحزمة
k this deck
49
If a data set produces SSR = 300 and SSE = 200, then the coefficient of determination is
A) .67.
B) .25.
C) .40.
D) .60.
A) .67.
B) .25.
C) .40.
D) .60.
فتح الحزمة
افتح القفل للوصول البطاقات البالغ عددها 132 في هذه المجموعة.
فتح الحزمة
k this deck
50
In a regression analysis, if SST = 4500 and SSR = 2925, then the coefficient of determination is
A) .35.
B) .65.
C) .85.
D) .45.
A) .35.
B) .65.
C) .85.
D) .45.
فتح الحزمة
افتح القفل للوصول البطاقات البالغ عددها 132 في هذه المجموعة.
فتح الحزمة
k this deck
51
A regression analysis between sales (in $1000) and price (in dollars) resulted in the following equation: = 40 - 6x
The above equation implies that an
A) increase of $1 in price is associated with a decrease of $6 in sales.
B) increase of $8 in price is associated with a decrease of $24,000 in sales.
C) increase of $1 in price is associated with a decrease of $240 in sales.
D) increase of $1 in price is associated with a decrease of $6000 in sales.
= 40 - 6x
The above equation implies that an
A) increase of $1 in price is associated with a decrease of $6 in sales.
B) increase of $8 in price is associated with a decrease of $24,000 in sales.
C) increase of $1 in price is associated with a decrease of $240 in sales.
D) increase of $1 in price is associated with a decrease of $6000 in sales.
فتح الحزمة
افتح القفل للوصول البطاقات البالغ عددها 132 في هذه المجموعة.
فتح الحزمة
k this deck
52
If two variables, x and y, have a strong linear relationship, then
A) there may or may not be any causal relationship between x and y.
B) x causes y to happen.
C) y causes x to happen.
D) the F test is used to conclude there is a causal relationship between x and y.
A) there may or may not be any causal relationship between x and y.
B) x causes y to happen.
C) y causes x to happen.
D) the F test is used to conclude there is a causal relationship between x and y.
فتح الحزمة
افتح القفل للوصول البطاقات البالغ عددها 132 في هذه المجموعة.
فتح الحزمة
k this deck
53
Regression analysis was applied between sales (in $1000) and advertising (in $100) and the following regression function was obtained. = 500 + 4x
Based on the above estimated regression line, if advertising is $10,000, then the point estimate for sales (in dollars) is
A) $900.
B) $900,000.
C) $40,500.
D) $505,000.
= 500 + 4x
Based on the above estimated regression line, if advertising is $10,000, then the point estimate for sales (in dollars) is
A) $900.
B) $900,000.
C) $40,500.
D) $505,000.
فتح الحزمة
افتح القفل للوصول البطاقات البالغ عددها 132 في هذه المجموعة.
فتح الحزمة
k this deck
54
A least squares regression line
A) can be used to predict a value of y if the corresponding x value is given.
B) implies a cause-and-effect relationship between x and y.
C) can only be determined if a good linear relationship exists between x and y.
D) ensures that the predictions of y outside the range of the values of x are valid.
فتح الحزمة
افتح القفل للوصول البطاقات البالغ عددها 132 في هذه المجموعة.
فتح الحزمة
k this deck
55
If all the points of a scatter diagram lie on the least squares regression line, then the coefficient of determination for these variables based on these data
A) is 0.
B) is 1.
C) is either 1 or -1, depending upon whether the relationship is positive or negative.
D) could be any value between -1 and 1.
A) is 0.
B) is 1.
C) is either 1 or -1, depending upon whether the relationship is positive or negative.
D) could be any value between -1 and 1.
فتح الحزمة
افتح القفل للوصول البطاقات البالغ عددها 132 في هذه المجموعة.
فتح الحزمة
k this deck
56
If the coefficient of correlation is a negative value, then the
A) intercept of the regression line must also be positive.
B) coefficient of determination can be either a negative or a positive value, depending on the slope.
C) regression equation could have either a positive or a negative slope.
D) slope of the regression line must be negative.
A) intercept of the regression line must also be positive.
B) coefficient of determination can be either a negative or a positive value, depending on the slope.
C) regression equation could have either a positive or a negative slope.
D) slope of the regression line must be negative.
فتح الحزمة
افتح القفل للوصول البطاقات البالغ عددها 132 في هذه المجموعة.
فتح الحزمة
k this deck
57
If there is a very strong correlation between two variables, then the coefficient of determination must be
A) much larger than 1, if the correlation is positive.
B) much smaller than -1, if the correlation is negative.
C) equal to zero.
D) closer or equal to 1.
A) much larger than 1, if the correlation is positive.
B) much smaller than -1, if the correlation is negative.
C) equal to zero.
D) closer or equal to 1.
فتح الحزمة
افتح القفل للوصول البطاقات البالغ عددها 132 في هذه المجموعة.
فتح الحزمة
k this deck
58
If the coefficient of correlation is .80, then the coefficient of determination
A) is also .80.
B) is either .64 or -.64.
C) will be -.80.
D) must be .64.
A) is also .80.
B) is either .64 or -.64.
C) will be -.80.
D) must be .64.
فتح الحزمة
افتح القفل للوصول البطاقات البالغ عددها 132 في هذه المجموعة.
فتح الحزمة
k this deck
59
In regression analysis, if the dependent variable is measured in dollars, the independent variable
A) must also be in dollars.
B) must be in some units of currency.
C) can be measured in any units.
D) cannot be in dollars.
A) must also be in dollars.
B) must be in some units of currency.
C) can be measured in any units.
D) cannot be in dollars.
فتح الحزمة
افتح القفل للوصول البطاقات البالغ عددها 132 في هذه المجموعة.
فتح الحزمة
k this deck
60
If the coefficient of correlation is .4, the percentage of variation in the dependent variable explained by the variation in the independent variable is
A) 40%.
B) 16%.
C) 4%.
D) 63%.
A) 40%.
B) 16%.
C) 4%.
D) 63%.
فتح الحزمة
افتح القفل للوصول البطاقات البالغ عددها 132 في هذه المجموعة.
فتح الحزمة
k this deck
61
Regression analysis was applied between sales data (y in $1000s) and advertising data (x in $100s) and the following information was obtained. = 12 + 1.8x
N = 17
SSR = 225
SSE = 75
Sb1 = .2683
The t statistic for testing the significance of the slope is
A) 1.80.
B) 1.96.
C) 6.71.
D) .56.
= 12 + 1.8x
N = 17
SSR = 225
SSE = 75
Sb1 = .2683
The t statistic for testing the significance of the slope is
A) 1.80.
B) 1.96.
C) 6.71.
D) .56.
فتح الحزمة
افتح القفل للوصول البطاقات البالغ عددها 132 في هذه المجموعة.
فتح الحزمة
k this deck
62
Regression analysis was applied between sales (y in $1000) and advertising (x in $100) and the following estimated regression equation was obtained. = 80 + 6.2x
Based on the above estimated regression line, if advertising is $10,000, then the point estimate for sales (in dollars) is
A) $62,080.
B) $142,000.
C) $700.
D) $700,000.
= 80 + 6.2x
Based on the above estimated regression line, if advertising is $10,000, then the point estimate for sales (in dollars) is
A) $62,080.
B) $142,000.
C) $700.
D) $700,000.
فتح الحزمة
افتح القفل للوصول البطاقات البالغ عددها 132 في هذه المجموعة.
فتح الحزمة
k this deck
63
You are given the following information about y and x. The least squares estimate of the slope or b1 equals
A) 1.
B) -1.
C) -10.75.
D) 10.75.
The least squares estimate of the slope or b1 equalsA) 1.
B) -1.
C) -10.75.
D) 10.75.
فتح الحزمة
افتح القفل للوصول البطاقات البالغ عددها 132 في هذه المجموعة.
فتح الحزمة
k this deck
64
You are given the following information about y and x. The sample correlation coefficient equals
A) 0.
B) +1.
C) -1.
D) -.5.
The sample correlation coefficient equalsA) 0.
B) +1.
C) -1.
D) -.5.
فتح الحزمة
افتح القفل للوصول البطاقات البالغ عددها 132 في هذه المجموعة.
فتح الحزمة
k this deck
65
The following information regarding a dependent variable (y) and an independent variable (x) is provided.
SSE = 1.9
SST = 6.8
The least squares estimate of the slope is
A) 1.
B) 3.4.
C) 3.
D) .7.
SSE = 1.9
SST = 6.8
The least squares estimate of the slope is
A) 1.
B) 3.4.
C) 3.
D) .7.
فتح الحزمة
افتح القفل للوصول البطاقات البالغ عددها 132 في هذه المجموعة.
فتح الحزمة
k this deck
66
You are given the following information about y and x. The sample correlation coefficient equals
A) -.7303.
B) .7303.
C) -.5333.
D) .5333.
The sample correlation coefficient equalsA) -.7303.
B) .7303.
C) -.5333.
D) .5333.
فتح الحزمة
افتح القفل للوصول البطاقات البالغ عددها 132 في هذه المجموعة.
فتح الحزمة
k this deck
67
The following information regarding a dependent variable (y) and an independent variable (x) is provided. SSE = 1.9
SST = 6.8
The least squares estimate of the y-intercept is
A) 1.
B) 3.4.
C) 3.
D) 4.7.
SSE = 1.9SST = 6.8
The least squares estimate of the y-intercept is
A) 1.
B) 3.4.
C) 3.
D) 4.7.
فتح الحزمة
افتح القفل للوصول البطاقات البالغ عددها 132 في هذه المجموعة.
فتح الحزمة
k this deck
68
If the coefficient of determination is .95, the percentage of variation in the dependent variable explained by the variation in the independent variable is
A) .95%.
B) 95%.
C) 90.25%.
D) .9025%.
A) .95%.
B) 95%.
C) 90.25%.
D) .9025%.
فتح الحزمة
افتح القفل للوصول البطاقات البالغ عددها 132 في هذه المجموعة.
فتح الحزمة
k this deck
69
The following information regarding a dependent variable (y) and an independent variable (x) is provided. SSE = 1.9
SST = 6.8
The MSE is
A) 4.9.
B) .63.
C) 6.8.
D) 1.9.
SSE = 1.9SST = 6.8
The MSE is
A) 4.9.
B) .63.
C) 6.8.
D) 1.9.
فتح الحزمة
افتح القفل للوصول البطاقات البالغ عددها 132 في هذه المجموعة.
فتح الحزمة
k this deck
70
You are given the following information about y and x. The point estimate of y when x = 2 is
A) -10.
B) 10.
C) -8.
D) 8.
The point estimate of y when x = 2 isA) -10.
B) 10.
C) -8.
D) 8.
فتح الحزمة
افتح القفل للوصول البطاقات البالغ عددها 132 في هذه المجموعة.
فتح الحزمة
k this deck
71
Regression analysis was applied between sales data (y in $1000s) and advertising data (x in $100s) and the following information was obtained. = 12 + 1.8x
N = 17
SSR = 225
SSE = 75
Sb1 = .2683
To perform an F test, the p-value is
A) less than .01.
B) between .01 and .025.
C) between .025 and .05.
D) greater than .10.
= 12 + 1.8x
N = 17
SSR = 225
SSE = 75
Sb1 = .2683
To perform an F test, the p-value is
A) less than .01.
B) between .01 and .025.
C) between .025 and .05.
D) greater than .10.
فتح الحزمة
افتح القفل للوصول البطاقات البالغ عددها 132 في هذه المجموعة.
فتح الحزمة
k this deck
72
The following information regarding a dependent variable (y) and an independent variable (x) is provided. SSE = 1.9
SST = 6.8
The coefficient of determination is
A) .8489.
B) -.7206.
C) .7206.
D) .375.
SSE = 1.9SST = 6.8
The coefficient of determination is
A) .8489.
B) -.7206.
C) .7206.
D) .375.
فتح الحزمة
افتح القفل للوصول البطاقات البالغ عددها 132 في هذه المجموعة.
فتح الحزمة
k this deck
73
You are given the following information about y and x. The least squares estimate of the slope or b1 equals
A) 1.
B) -2.
C) 3.
D) 12.
The least squares estimate of the slope or b1 equalsA) 1.
B) -2.
C) 3.
D) 12.
فتح الحزمة
افتح القفل للوصول البطاقات البالغ عددها 132 في هذه المجموعة.
فتح الحزمة
k this deck
74
Regression analysis was applied between sales data (y in $1000s) and advertising data (x in $100s) and the following information was obtained. = 12 + 1.8x
N = 17
SSR = 225
SSE = 75
Sb1 = .2683
Based on the above estimated regression equation, if advertising is $3000, then the point estimate for sales (in dollars) is
A) $66,000.
B) $5412.
C) $66.
D) $17,400.
= 12 + 1.8x
N = 17
SSR = 225
SSE = 75
Sb1 = .2683
Based on the above estimated regression equation, if advertising is $3000, then the point estimate for sales (in dollars) is
A) $66,000.
B) $5412.
C) $66.
D) $17,400.
فتح الحزمة
افتح القفل للوصول البطاقات البالغ عددها 132 في هذه المجموعة.
فتح الحزمة
k this deck
75
Regression analysis was applied between sales data (y in $1000s) and advertising data (x in $100s) and the following information was obtained. = 12 + 1.8x
N = 17
SSR = 225
SSE = 75
Sb1 = .2683
The F statistic computed from the above data is
A) 3.
B) 45.
C) 48.
D) 50.
= 12 + 1.8x
N = 17
SSR = 225
SSE = 75
Sb1 = .2683
The F statistic computed from the above data is
A) 3.
B) 45.
C) 48.
D) 50.
فتح الحزمة
افتح القفل للوصول البطاقات البالغ عددها 132 في هذه المجموعة.
فتح الحزمة
k this deck
76
You are given the following information about y and x. The coefficient of determination equals
A) 0.
B) -1.
C) +1.
D) -.5.
The coefficient of determination equalsA) 0.
B) -1.
C) +1.
D) -.5.
فتح الحزمة
افتح القفل للوصول البطاقات البالغ عددها 132 في هذه المجموعة.
فتح الحزمة
k this deck
77
The following information regarding a dependent variable (y) and an independent variable (x) is provided. SSE = 1.9
SST = 6.8
The coefficient of correlation is
A) .8489.
B) -.7206.
C) .7206.
D) .375.
SSE = 1.9SST = 6.8
The coefficient of correlation is
A) .8489.
B) -.7206.
C) .7206.
D) .375.
فتح الحزمة
افتح القفل للوصول البطاقات البالغ عددها 132 في هذه المجموعة.
فتح الحزمة
k this deck
78
You are given the following information about y and x.
The least squares estimate of the intercept or b0 equals
A) 1.
B) -2.
C) 12.
D) 4.
The least squares estimate of the intercept or b0 equals
A) 1.
B) -2.
C) 12.
D) 4.
فتح الحزمة
افتح القفل للوصول البطاقات البالغ عددها 132 في هذه المجموعة.
فتح الحزمة
k this deck
79
You are given the following information about y and x. The coefficient of determination equals
A) -.7303.
B) .7303.
C) -.5333.
D) .5333.
The coefficient of determination equalsA) -.7303.
B) .7303.
C) -.5333.
D) .5333.
فتح الحزمة
افتح القفل للوصول البطاقات البالغ عددها 132 في هذه المجموعة.
فتح الحزمة
k this deck
80
You are given the following information about y and x. The least squares estimate of the intercept or b0 equals
A) 1.
B) -1.
C) -10.75.
D) 10.75.
The least squares estimate of the intercept or b0 equalsA) 1.
B) -1.
C) -10.75.
D) 10.75.
فتح الحزمة
افتح القفل للوصول البطاقات البالغ عددها 132 في هذه المجموعة.
فتح الحزمة
k this deck
فتح الحزمة
افتح القفل للوصول البطاقات البالغ عددها 132 في هذه المجموعة.


