Deck 10: Inference About Means and Proportions With Two Populations
ملء الشاشة (f)
سؤال
سؤال
سؤال
The standard error of  -
-  is the
A) pooled estimator of -
-  .
.
B) variance of the sampling distribution of -
-  .
.
C) standard deviation of the sampling distribution of -
-  .
.
D) margin of error of -
-  .
.
- is theA) pooled estimator of
- .B) variance of the sampling distribution of
- .C) standard deviation of the sampling distribution of
- .D) margin of error of
- . سؤال
The following information was obtained from matched samples taken from two populations. The daily production rates for a sample of workers before and after a training program are shown below.Assume the population of differences is normally distributed. 
The null hypothesis to be tested is H0: μd = 0.The test statistic is
A) -1.96.
B) 1.77.
C) 0.
D) 1.00.
The null hypothesis to be tested is H0: μd = 0.The test statistic is
A) -1.96.
B) 1.77.
C) 0.
D) 1.00.
سؤال
Salary information regarding male and female employees of a large company is shown below. 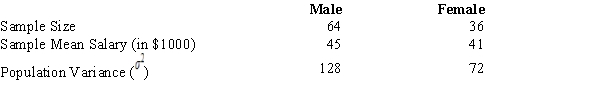 At 95% confidence, the margin of error is
A) 1.960.
B) 1.645.
C) 3.920.
D) 7.839.
At 95% confidence, the margin of error isA) 1.960.
B) 1.645.
C) 3.920.
D) 7.839.
سؤال
The sampling distribution of  -
-  is approximated by a
A) normal distribution.
B) t distribution with n1 + n2 degrees of freedom.
C) t distribution with n1 + n2 - 1 degrees of freedom.
D) -
-  distribution.
- is approximated by aA) normal distribution.
B) t distribution with n1 + n2 degrees of freedom.
C) t distribution with n1 + n2 - 1 degrees of freedom.
D)
- distribution. سؤال
The following information was obtained from matched samples taken from two populations. The daily production rates for a sample of workers before and after a training program are shown below.Assume the population of differences is normally distributed. 
The point estimate for the difference between the means of the two populations is
A) -1.
B) -2.
C) 0.
D) 1.
The point estimate for the difference between the means of the two populations is
A) -1.
B) -2.
C) 0.
D) 1.
سؤال
سؤال
سؤال
A statistics teacher wants to see if there is any difference in the abilities of students enrolled in statistics today and those enrolled five years ago.A sample of final examination scores from students enrolled today and from students enrolled five years ago was taken.You are given the following information.  The point estimate for the difference between the means of the two populations is
A) 58.5.
B) 9.
C) -9.
D) -6.
The point estimate for the difference between the means of the two populations isA) 58.5.
B) 9.
C) -9.
D) -6.
سؤال
The following information was obtained from matched samples taken from two populations. The daily production rates for a sample of workers before and after a training program are shown below.Assume the population of differences is normally distributed. 
Given that the null hypothesis to be tested is H0: μd = 0,
A) the null hypothesis should be rejected.
B) the null hypothesis should not be rejected.
C) the alternative hypothesis should be revised.
D) the null hypothesis should be revised.
Given that the null hypothesis to be tested is H0: μd = 0,
A) the null hypothesis should be rejected.
B) the null hypothesis should not be rejected.
C) the alternative hypothesis should be revised.
D) the null hypothesis should be revised.
سؤال
سؤال
Salary information regarding male and female employees of a large company is shown below. 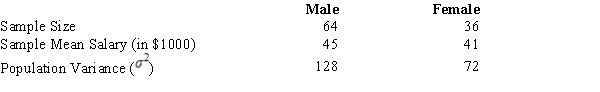 If you are interested in testing whether or not the population average salary of males is significantly greater than that of females, at α = .05, the conclusion is that the population
A) average salary of males is significantly greater than females.
B) average salary of males is significantly lower than females.
C) salaries of males and females are equal.
D) average salary of males is greater than females cannot be proved.
If you are interested in testing whether or not the population average salary of males is significantly greater than that of females, at α = .05, the conclusion is that the populationA) average salary of males is significantly greater than females.
B) average salary of males is significantly lower than females.
C) salaries of males and females are equal.
D) average salary of males is greater than females cannot be proved.
سؤال
Salary information regarding male and female employees of a large company is shown below. 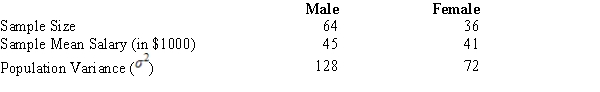 If you are interested in testing whether or not the population average salary of males is significantly greater than that of females at an α = .05, the test statistic is
A) 2.0.
B) 1.5.
C) 1.96.
D) 1.645.
If you are interested in testing whether or not the population average salary of males is significantly greater than that of females at an α = .05, the test statistic isA) 2.0.
B) 1.5.
C) 1.96.
D) 1.645.
سؤال
Salary information regarding male and female employees of a large company is shown below. 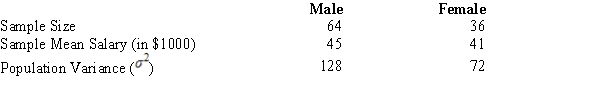 The 95% confidence interval for the difference between the means of the two populations is
A) 0 to 6.92.
B) -2 to 2.
C) -1.96 to 1.96.
D) 0.08 to 7.92.
The 95% confidence interval for the difference between the means of the two populations isA) 0 to 6.92.
B) -2 to 2.
C) -1.96 to 1.96.
D) 0.08 to 7.92.
سؤال
Salary information regarding male and female employees of a large company is shown below. 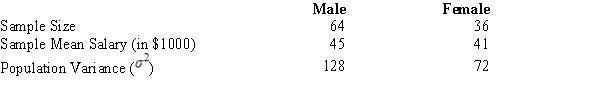 The point estimate of the difference between the means of the two populations is
A) -28.
B) 3.
C) 4.
D) -4.
The point estimate of the difference between the means of the two populations isA) -28.
B) 3.
C) 4.
D) -4.
سؤال
سؤال
Salary information regarding male and female employees of a large company is shown below.  The standard error of the difference between the two sample means is
A) 4.
B) 7.46.
C) 4.24.
D) 2.0.
The standard error of the difference between the two sample means isA) 4.
B) 7.46.
C) 4.24.
D) 2.0.
سؤال
سؤال
سؤال
In order to determine whether or not there is a significant difference between the mean hourly wages paid by two companies (of the same industry), the following data have been accumulated.  The test statistic is
A) .098.
B) 1.645.
C) 2.75.
D) 3.08.
The test statistic isA) .098.
B) 1.645.
C) 2.75.
D) 3.08.
سؤال
A statistics teacher wants to see if there is any difference in the abilities of students enrolled in statistics today and those enrolled five years ago.A sample of final examination scores from students enrolled today and from students enrolled five years ago was taken.You are given the following information. 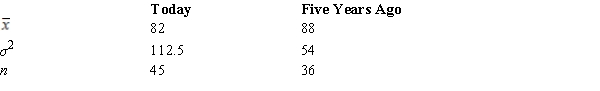 The standard error of
  -
-  is
is
A) 12.9.
B) 9.3.
C) 4.
D) 2.
The standard error of - isA) 12.9.
B) 9.3.
C) 4.
D) 2.
سؤال
A statistics teacher wants to see if there is any difference in the abilities of students enrolled in statistics today and those enrolled five years ago.A sample of final examination scores from students enrolled today and from students enrolled five years ago was taken.You are given the following information.  The test statistic for the difference between the two population means is
A) -.47.
B) -.65.
C) -1.5.
D) -3.0.
The test statistic for the difference between the two population means isA) -.47.
B) -.65.
C) -1.5.
D) -3.0.
سؤال
The management of a department store is interested in estimating the difference between the mean credit purchases of customers using the store's credit card versus those customers using a national major credit card.You are given the following information.  A point estimate for the difference between the mean purchases of all users of the two credit cards is
A) 20.
B) 2.
C) 260.
D) 15.
A point estimate for the difference between the mean purchases of all users of the two credit cards isA) 20.
B) 2.
C) 260.
D) 15.
سؤال
The following information was obtained from matched samples taken from two populations.Assume the population of differences is normally distributed.  The point estimate for the difference between the means of the two populations (Method 1 - Method 2) is
A) -1.
B) 0.
C) -4.
D) 2.
The point estimate for the difference between the means of the two populations (Method 1 - Method 2) isA) -1.
B) 0.
C) -4.
D) 2.
سؤال
A statistics teacher wants to see if there is any difference in the abilities of students enrolled in statistics today and those enrolled five years ago.A sample of final examination scores from students enrolled today and from students enrolled five years ago was taken.You are given the following information.  The p-value for the difference between the two population means is
A) .0013.
B) .0027.
C) .4987.
D) .9987.
The p-value for the difference between the two population means isA) .0013.
B) .0027.
C) .4987.
D) .9987.
سؤال
The following information was obtained from independent random samples taken of two populations. Assume normally distributed populations with equal variances. 
The 95% confidence interval for the difference between the two population means is (use rounded standard error)
A) -5.344 to 11.344.
B) -5 to 3.
C) -4.86 to 10.86.
D) -2.65 to 8.65.
The 95% confidence interval for the difference between the two population means is (use rounded standard error)
A) -5.344 to 11.344.
B) -5 to 3.
C) -4.86 to 10.86.
D) -2.65 to 8.65.
سؤال
In order to determine whether or not there is a significant difference between the mean hourly wages paid by two companies (of the same industry), the following data have been accumulated.  A point estimate for the difference between the two population means is
A) 20.
B) .50.
C) .25.
D) 1.00.
A point estimate for the difference between the two population means isA) 20.
B) .50.
C) .25.
D) 1.00.
سؤال
The following information was obtained from independent random samples taken of two populations. Assume normally distributed populations with equal variances. 
The point estimate for the difference between the means of the two populations is
A) 0.
B) -3.
C) 3.
D) 15.
The point estimate for the difference between the means of the two populations is
A) 0.
B) -3.
C) 3.
D) 15.
سؤال
The following information was obtained from independent random samples taken of two populations. Assume normally distributed populations with equal variances. 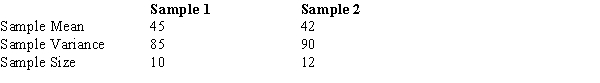
The standard error of -
-  is
is
A) 3.0.
B) 4.
C) 8.372.
D) 19.48.
The standard error of
- isA) 3.0.
B) 4.
C) 8.372.
D) 19.48.
سؤال
The following information was obtained from matched samples taken from two populations.Assume the population of differences is normally distributed.  If the null hypothesis H0: μd = 0 is tested at the 5% level,
A) the null hypothesis should be rejected.
B) the null hypothesis should not be rejected.
C) the alternative hypothesis should be revised.
D) the null hypothesis should be revised.
If the null hypothesis H0: μd = 0 is tested at the 5% level,A) the null hypothesis should be rejected.
B) the null hypothesis should not be rejected.
C) the alternative hypothesis should be revised.
D) the null hypothesis should be revised.
سؤال
A statistics teacher wants to see if there is any difference in the abilities of students enrolled in statistics today and those enrolled five years ago.A sample of final examination scores from students enrolled today and from students enrolled five years ago was taken.You are given the following information. 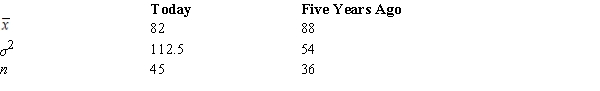 The 98% confidence interval for the difference between the two population means is
A) -9.92 to -2.08.
B) -10.66 to -1.34.
C) -13.84 to -1.16.
D) -24.77 to 12.23.
The 98% confidence interval for the difference between the two population means isA) -9.92 to -2.08.
B) -10.66 to -1.34.
C) -13.84 to -1.16.
D) -24.77 to 12.23.
سؤال
The management of a department store is interested in estimating the difference between the mean credit purchases of customers using the store's credit card versus those customers using a national major credit card.You are given the following information. 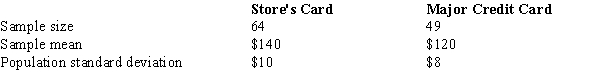 A 95% confidence interval estimate for the difference between the average purchases of all customers using the two different credit cards is
A) 13.31 to 16.69.
B) 11.68 to 18.32.
C) 12.22 to 17.78.
D) 16.68 to 23.32.
A 95% confidence interval estimate for the difference between the average purchases of all customers using the two different credit cards isA) 13.31 to 16.69.
B) 11.68 to 18.32.
C) 12.22 to 17.78.
D) 16.68 to 23.32.
سؤال
The following information was obtained from independent random samples taken of two populations. Assume normally distributed populations with equal variances. 
The degrees of freedom for the t distribution are
A) 22.
B) 10.
C) 24.
D) 20.
The degrees of freedom for the t distribution are
A) 22.
B) 10.
C) 24.
D) 20.
سؤال
The following information was obtained from matched samples taken from two populations.Assume the population of differences is normally distributed.  The 98% confidence interval for the difference between the two population means is
A) -3.776 to 1.776.
B) -4.747 to 2.747.
C) -1.776 to 2.776.
D) -4.747 to 1.776.
The 98% confidence interval for the difference between the two population means isA) -3.776 to 1.776.
B) -4.747 to 2.747.
C) -1.776 to 2.776.
D) -4.747 to 1.776.
سؤال
A statistics teacher wants to see if there is any difference in the abilities of students enrolled in statistics today and those enrolled five years ago.A sample of final examination scores from students enrolled today and from students enrolled five years ago was taken.You are given the following information.  What is the conclusion that can be reached about the difference in the average final examination scores between the two classes? (Use a .05 level of significance.)
A) There is a statistically significant difference in the average final examination scores between the two classes.
B) There is no statistically significant difference in the average final examination scores between the two classes.
C) It is impossible to make a decision on the basis of the information given.
D) The students who enrolled in statistics today are the same students who enrolled five years ago.
What is the conclusion that can be reached about the difference in the average final examination scores between the two classes? (Use a .05 level of significance.)A) There is a statistically significant difference in the average final examination scores between the two classes.
B) There is no statistically significant difference in the average final examination scores between the two classes.
C) It is impossible to make a decision on the basis of the information given.
D) The students who enrolled in statistics today are the same students who enrolled five years ago.
سؤال
In order to estimate the difference between the average hourly wages of employees of two branches of a department store, the following data have been gathered.  A 95% interval estimate for the difference between the two population means is
A) .071 to 1.929.
B) .226 to 1.774.
C) 1.09 to 4.078.
D) 1.078 to 2.922.
A 95% interval estimate for the difference between the two population means isA) .071 to 1.929.
B) .226 to 1.774.
C) 1.09 to 4.078.
D) 1.078 to 2.922.
سؤال
The following information was obtained from matched samples taken from two populations.Assume the population of differences is normally distributed.  The null hypothesis tested is H0: μd = 0.The test statistic for the difference between the two population means is
A) 2.
B) 0.
C) -1.
D) -2.
The null hypothesis tested is H0: μd = 0.The test statistic for the difference between the two population means isA) 2.
B) 0.
C) -1.
D) -2.
سؤال
In order to estimate the difference between the average hourly wages of employees of two branches of a department store, the following data have been gathered. 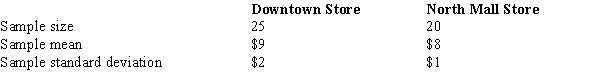 A point estimate for the difference between the two population means is
A) 1.
B) 2.
C) 3.
D) 4.
A point estimate for the difference between the two population means isA) 1.
B) 2.
C) 3.
D) 4.
سؤال
The management of a department store is interested in estimating the difference between the mean credit purchases of customers using the store's credit card versus those customers using a national major credit card.You are given the following information.  At 95% confidence, the margin of error is
A) 1.694.
B) 3.32.
C) 1.96.
D) 15.
At 95% confidence, the margin of error isA) 1.694.
B) 3.32.
C) 1.96.
D) 15.
سؤال
An insurance company selected samples of clients under 18 years of age and over 18 and recorded the number of accidents they had in the previous year.The results are shown below.  We are interested in determining if the accident proportions differ between the two age groups.Let pu represent the proportion under and po the proportion over the age of 18.The null hypothesis is
A) pu - po ≤ 0.
B) pu - po ≥ 0.
C) pu - po ≠ 0.
D) pu - po = 0.
We are interested in determining if the accident proportions differ between the two age groups.Let pu represent the proportion under and po the proportion over the age of 18.The null hypothesis isA) pu - po ≤ 0.
B) pu - po ≥ 0.
C) pu - po ≠ 0.
D) pu - po = 0.
سؤال
An insurance company selected samples of clients under 18 years of age and over 18 and recorded the number of accidents they had in the previous year.The results are shown below. 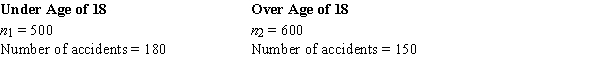 We are interested in determining if the accident proportions differ between the two age groups.The p-value is
A) less than .001.
B) more than .10.
C) .0228.
D) .3.
We are interested in determining if the accident proportions differ between the two age groups.The p-value isA) less than .001.
B) more than .10.
C) .0228.
D) .3.
سؤال
An insurance company selected samples of clients under 18 years of age and over 18 and recorded the number of accidents they had in the previous year.The results are shown below.  We are interested in determining if the accident proportions differ between the two age groups.
The pooled estimator of the population proportion is
A) .305.
B) .300.
C) .027.
D) .450.
We are interested in determining if the accident proportions differ between the two age groups.The pooled estimator of the population proportion is
A) .305.
B) .300.
C) .027.
D) .450.
سؤال
Two major automobile manufacturers have produced compact cars with engines of the same size.We are interested in determining whether or not there is a significant difference in the mean MPG (miles per gallon) when testing for the fuel efficiency of these two brands of automobiles.A random sample of eight cars from each manufacturer is selected, and eight drivers are selected to drive each automobile for a specified distance.The following data (in miles per gallon) show the results of the test.Assume the population of differences is normally distributed.  The mean of the differences is
A) .5.
B) 1.5.
C) 2.0.
D) 2.5.
The mean of the differences isA) .5.
B) 1.5.
C) 2.0.
D) 2.5.
سؤال
In hypothesis tests about p1 - p2, the pooled estimator of p is a(n)
A) simple average of and
and  .
.
B) weighted average of and
and  .
.
C) geometric average of and
and  .
.
D) exponential average of and
and  .
.
A) simple average of
and .B) weighted average of
and .C) geometric average of
and .D) exponential average of
and . سؤال
سؤال
The results of a recent poll on the preference of shoppers regarding two products are shown below.  The point estimate for the difference between the two population proportions in favor of this product is
A) .07.
B) .68.
C) .44.
D) .02.
The point estimate for the difference between the two population proportions in favor of this product isA) .07.
B) .68.
C) .44.
D) .02.
سؤال
In order to determine whether or not there is a significant difference between the mean hourly wages paid by two companies (of the same industry), the following data have been accumulated. 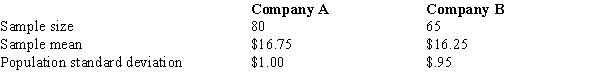 The p-value is
A) .0010.
B) .0021.
C) .0042.
D) .9990.
The p-value isA) .0010.
B) .0021.
C) .0042.
D) .9990.
سؤال
سؤال
The results of a recent poll on the preference of shoppers regarding two products are shown below.  At 95% confidence, the margin of error is
A) .064.
B) .044.
C) .0225.
D) .025.
At 95% confidence, the margin of error isA) .064.
B) .044.
C) .0225.
D) .025.
سؤال
The results of a recent poll on the preference of shoppers regarding two products are shown below.  The 95% confidence interval estimate for the difference between the populations favoring the products is
A) -.024 to .064.
B) .6 to .7.
C) -.024 to .7.
D) .046 to .066.
The 95% confidence interval estimate for the difference between the populations favoring the products isA) -.024 to .064.
B) .6 to .7.
C) -.024 to .7.
D) .046 to .066.
سؤال
The sampling distribution of  -
-  is approximated by a normal distribution if _____ are all greater than or equal to 5.
A) n1p2, p2(1 - n2), n2p1, p1(1 - n1)
B) n1p1, p1(1 - n1), n2p2, p2(1 - n2)
C) n1p2, n1(1 - p2), n2p1, n2(1 - p1)
D) n1p1, n1(1 - p1), n2p2, n2(1 - p2)
- is approximated by a normal distribution if _____ are all greater than or equal to 5.A) n1p2, p2(1 - n2), n2p1, p1(1 - n1)
B) n1p1, p1(1 - n1), n2p2, p2(1 - n2)
C) n1p2, n1(1 - p2), n2p1, n2(1 - p1)
D) n1p1, n1(1 - p1), n2p2, n2(1 - p2)
سؤال
Two major automobile manufacturers have produced compact cars with engines of the same size.We are interested in determining whether or not there is a significant difference in the mean MPG (miles per gallon) when testing for the fuel efficiency of these two brands of automobiles.A random sample of eight cars from each manufacturer is selected, and eight drivers are selected to drive each automobile for a specified distance.The following data (in miles per gallon) show the results of the test.Assume the population of differences is normally distributed.  At α = .10, the null hypothesis
A) should not be rejected.
B) should be rejected.
C) should be revised.
D) should not be tested.
At α = .10, the null hypothesisA) should not be rejected.
B) should be rejected.
C) should be revised.
D) should not be tested.
سؤال
In testing the null hypothesis H0:  1 - ?2 = 0, the computed test statistic is z = -1.66.The corresponding p-value is?
A) ?.0485.
B) ?.0970.
C) ?.9515.
D) ?.9030.
1 - ?2 = 0, the computed test statistic is z = -1.66.The corresponding p-value is?A) ?.0485.
B) ?.0970.
C) ?.9515.
D) ?.9030.
سؤال
Two major automobile manufacturers have produced compact cars with engines of the same size.We are interested in determining whether or not there is a significant difference in the mean MPG (miles per gallon) when testing for the fuel efficiency of these two brands of automobiles.A random sample of eight cars from each manufacturer is selected, and eight drivers are selected to drive each automobile for a specified distance.The following data (in miles per gallon) show the results of the test.Assume the population of differences is normally distributed.  The test statistic is
A) 1.616.
B) 1.906.
C) 2.096.
D) 2.256.
The test statistic isA) 1.616.
B) 1.906.
C) 2.096.
D) 2.256.
سؤال
سؤال
The results of a recent poll on the preference of teenagers regarding the types of music they listen to are shown below.  The 95% confidence interval for the difference between the two population proportions is
A) .5 to .52.
B) .48 to .5.
C) .028 to .068.
D) -.068 to .028.
The 95% confidence interval for the difference between the two population proportions isA) .5 to .52.
B) .48 to .5.
C) .028 to .068.
D) -.068 to .028.
سؤال
In order to determine whether or not there is a significant difference between the mean hourly wages paid by two companies (of the same industry), the following data have been accumulated.  At the 5% level of significance, the null hypothesis
A) should be rejected.
B) should not be rejected.
C) should be revised.
D) should not be tested.
At the 5% level of significance, the null hypothesisA) should be rejected.
B) should not be rejected.
C) should be revised.
D) should not be tested.
سؤال
The results of a recent poll on the preference of teenagers regarding the types of music they listen to are shown below.  The point estimate of the difference between the two population proportions is
A) -.02.
B) .048.
C) .52.
D) -.5.
The point estimate of the difference between the two population proportions isA) -.02.
B) .048.
C) .52.
D) -.5.
سؤال
The results of a recent poll on the preference of shoppers regarding two products are shown below.  The standard error of
  -
-  is
is
A) .025.
B) .044.
C) .0225.
D) .68.
The standard error of - isA) .025.
B) .044.
C) .0225.
D) .68.
سؤال
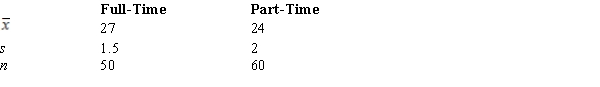
Using the following data regarding the ages (in years) of full-time and part-time students, develop an interval estimate for the difference between the mean ages of the two populations.Use 95% confidence.The degrees of freedom for the t distribution is 106.
سؤال
The following information is given concerning the ACT scores of high school seniors from two local schools. 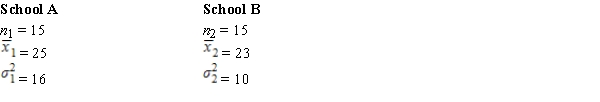
Develop a 98% confidence interval estimate for the difference between the two population means.Assume the two populations are normally distributed.
Develop a 98% confidence interval estimate for the difference between the two population means.Assume the two populations are normally distributed.
سؤال
سؤال
Samples of employees of Companies A and B provided the following information regarding the ages of employees. 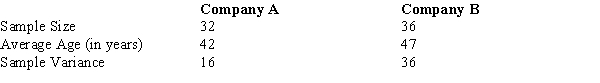
Develop a 97% confidence interval for the difference between the average ages of the employees of the two companies.
Develop a 97% confidence interval for the difference between the average ages of the employees of the two companies.
سؤال
The following table shows the monthly sales (in units) of six salespersons before and after a bonus plan was introduced.Using α = .05, determine whether the bonus plan has increased sales significantly.Assume the population of differences is normally distributed.(For the following matched samples, let the difference d = After - Before.) 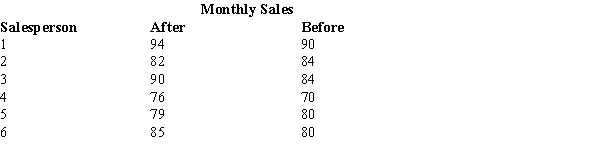
سؤال
The business manager of a local health clinic is interested in estimating the difference between the fees for extended office visits in her center and the fees of a newly opened group practice.She gathered the following information regarding the two offices. 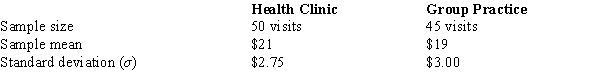
Develop a 95% confidence interval estimate for the difference between the average fees of the two offices.
Develop a 95% confidence interval estimate for the difference between the average fees of the two offices.
سؤال
The following information was obtained from matched samples regarding the productivity (in units per hour) of four individuals using two different methods of production. 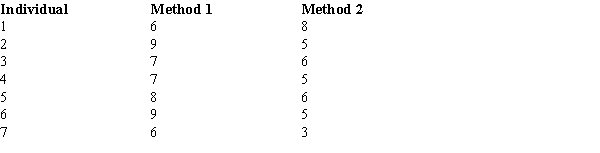
Let d = Method 1 - Method 2.Is there a significant difference between the mean productivity of the two methods? Let α = .05.Assume the population of differences is normally distributed.
Let d = Method 1 - Method 2.Is there a significant difference between the mean productivity of the two methods? Let α = .05.Assume the population of differences is normally distributed.
سؤال
A credit company has gathered information regarding the average amount (in $) owed by people under 30 years of age and by people over 30 years by taking independent random samples from both age groups.You are given the following information. 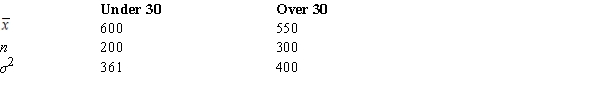
Construct a 95% confidence interval for the difference between the population average amounts owed by the two age groups.
Construct a 95% confidence interval for the difference between the population average amounts owed by the two age groups.
سؤال
Independent random samples of managers' yearly salaries (in $1000) taken from governmental and private organizations provided the following information.At a .05 level of significance, test to determine if there is a significant difference between the average salaries of the managers in the two sectors. 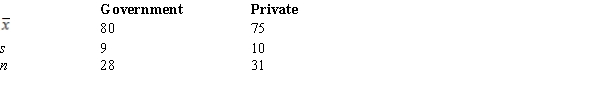
سؤال
A comparative study of organic and conventionally grown produce was checked for the presence of E.coli.Results are summarized below.Is there a significant difference in the proportion of E.coli in organic vs.conventionally grown produce? Test at α = .10. 
سؤال
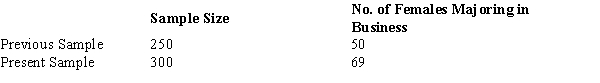
The office of records at a university has stated that the proportion of incoming female students who major in business has increased.A sample of female students taken several years ago is compared with a sample of female students this year.Results are summarized below.Has the proportion increased significantly? Test at α = .10.
سؤال
سؤال
The following information is gathered from random samples of day and evening students regarding the number of semester hours they take.
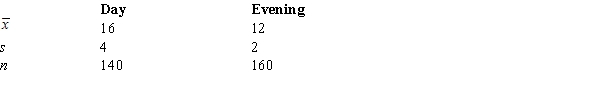
Develop a 95% confidence interval estimate for the difference between the mean semester hours taken by the two groups of students.
Develop a 95% confidence interval estimate for the difference between the mean semester hours taken by the two groups of students.
سؤال
The following data present the number of computer units sold per day by a sample of 6 salespersons before and after a bonus plan was implemented. 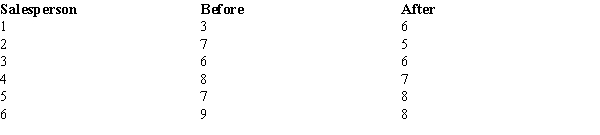
Using a .05 level of significance, test to see if the bonus plan was effective.That is, did the bonus plan actually increase sales? Assume the population of differences is normally distributed.Let d = After - Before.
Using a .05 level of significance, test to see if the bonus plan was effective.That is, did the bonus plan actually increase sales? Assume the population of differences is normally distributed.Let d = After - Before.
سؤال
سؤال
In order to estimate the difference between the average age of male and female employees at the Young Corporation, the following information was gathered.Develop a 95% confidence interval estimate. 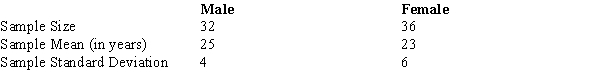
سؤال
Test scores on a standardized test from samples of students from two universities are given below. 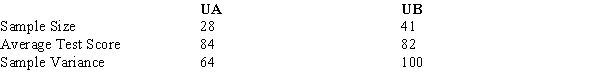
Provide a 98% confidence interval estimate for the difference between the mean test scores of the two universities.
Provide a 98% confidence interval estimate for the difference between the mean test scores of the two universities.
سؤال
The following are the results about the test scores of two samples of students from University A and University B on a national statistics examination.The population standard deviations are also shown below.Develop a 95% confidence interval estimate for the difference between the mean scores of the two populations. 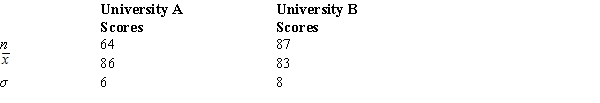
سؤال
سؤال
The results of a recent poll on the preference of voters regarding presidential candidates are shown below. 
Using α = .05, test to determine whether or not there is a significant difference between the preferences for the two candidates.
Using α = .05, test to determine whether or not there is a significant difference between the preferences for the two candidates.

فتح الحزمة
قم بالتسجيل لفتح البطاقات في هذه المجموعة!
Unlock Deck
Unlock Deck
1/85
العب
ملء الشاشة (f)
Deck 10: Inference About Means and Proportions With Two Populations
1
Two independent simple random samples are taken to test the difference between the means of two populations whose variances are not known, but are assumed to be equal.The sample sizes are n1 = 31 and n2 = 40.The correct distribution to use is the t distribution with _____ degrees of freedom.
A) 73
B) 72
C) 71
D) 69
A) 73
B) 72
C) 71
D) 69
69
2
If two independent large samples are taken from two populations, the sampling distribution of the difference between the two sample means
A) can be approximated by any distribution.
B) will have a variance of one.
C) can be approximated by a normal distribution.
D) will have a mean of one.
A) can be approximated by any distribution.
B) will have a variance of one.
C) can be approximated by a normal distribution.
D) will have a mean of one.
can be approximated by a normal distribution.
3
The standard error of - is the
A) pooled estimator of - .
B) variance of the sampling distribution of - .
C) standard deviation of the sampling distribution of - .
D) margin of error of - .
- is theA) pooled estimator of
- .B) variance of the sampling distribution of
- .C) standard deviation of the sampling distribution of
- .D) margin of error of
- .standard deviation of the sampling distribution of - .
- . 4
The following information was obtained from matched samples taken from two populations. The daily production rates for a sample of workers before and after a training program are shown below.Assume the population of differences is normally distributed.
The null hypothesis to be tested is H0: μd = 0.The test statistic is
A) -1.96.
B) 1.77.
C) 0.
D) 1.00.
The null hypothesis to be tested is H0: μd = 0.The test statistic is
A) -1.96.
B) 1.77.
C) 0.
D) 1.00.
فتح الحزمة
افتح القفل للوصول البطاقات البالغ عددها 85 في هذه المجموعة.
فتح الحزمة
k this deck
5
Salary information regarding male and female employees of a large company is shown below. At 95% confidence, the margin of error is
A) 1.960.
B) 1.645.
C) 3.920.
D) 7.839.
At 95% confidence, the margin of error isA) 1.960.
B) 1.645.
C) 3.920.
D) 7.839.
فتح الحزمة
افتح القفل للوصول البطاقات البالغ عددها 85 في هذه المجموعة.
فتح الحزمة
k this deck
6
The sampling distribution of - is approximated by a
A) normal distribution.
B) t distribution with n1 + n2 degrees of freedom.
C) t distribution with n1 + n2 - 1 degrees of freedom.
D) - distribution.
- is approximated by aA) normal distribution.
B) t distribution with n1 + n2 degrees of freedom.
C) t distribution with n1 + n2 - 1 degrees of freedom.
D)
- distribution. فتح الحزمة
افتح القفل للوصول البطاقات البالغ عددها 85 في هذه المجموعة.
فتح الحزمة
k this deck
7
The following information was obtained from matched samples taken from two populations. The daily production rates for a sample of workers before and after a training program are shown below.Assume the population of differences is normally distributed.
The point estimate for the difference between the means of the two populations is
A) -1.
B) -2.
C) 0.
D) 1.
The point estimate for the difference between the means of the two populations is
A) -1.
B) -2.
C) 0.
D) 1.
فتح الحزمة
افتح القفل للوصول البطاقات البالغ عددها 85 في هذه المجموعة.
فتح الحزمة
k this deck
8
To compute an interval estimate for the difference between the means of two populations, the t distribution
A) is restricted to small sample situations.
B) is not restricted to small sample situations.
C) can be applied when the populations have equal means.
D) can be applied only when the populations have equal standard deviations.
A) is restricted to small sample situations.
B) is not restricted to small sample situations.
C) can be applied when the populations have equal means.
D) can be applied only when the populations have equal standard deviations.
فتح الحزمة
افتح القفل للوصول البطاقات البالغ عددها 85 في هذه المجموعة.
فتح الحزمة
k this deck
9
When developing an interval estimate for the difference between two population means with sample sizes of n1 and n2,
A) n1 must be equal to n2.
B) n1 must be smaller than n2.
C) n1 must be larger than n2.
D) n1 and n2 can be of different sizes.
A) n1 must be equal to n2.
B) n1 must be smaller than n2.
C) n1 must be larger than n2.
D) n1 and n2 can be of different sizes.
فتح الحزمة
افتح القفل للوصول البطاقات البالغ عددها 85 في هذه المجموعة.
فتح الحزمة
k this deck
10
A statistics teacher wants to see if there is any difference in the abilities of students enrolled in statistics today and those enrolled five years ago.A sample of final examination scores from students enrolled today and from students enrolled five years ago was taken.You are given the following information. The point estimate for the difference between the means of the two populations is
A) 58.5.
B) 9.
C) -9.
D) -6.
The point estimate for the difference between the means of the two populations isA) 58.5.
B) 9.
C) -9.
D) -6.
فتح الحزمة
افتح القفل للوصول البطاقات البالغ عددها 85 في هذه المجموعة.
فتح الحزمة
k this deck
11
The following information was obtained from matched samples taken from two populations. The daily production rates for a sample of workers before and after a training program are shown below.Assume the population of differences is normally distributed.
Given that the null hypothesis to be tested is H0: μd = 0,
A) the null hypothesis should be rejected.
B) the null hypothesis should not be rejected.
C) the alternative hypothesis should be revised.
D) the null hypothesis should be revised.
Given that the null hypothesis to be tested is H0: μd = 0,
A) the null hypothesis should be rejected.
B) the null hypothesis should not be rejected.
C) the alternative hypothesis should be revised.
D) the null hypothesis should be revised.
فتح الحزمة
افتح القفل للوصول البطاقات البالغ عددها 85 في هذه المجموعة.
فتح الحزمة
k this deck
12
When each data value in one sample is matched with a corresponding data value in another sample, the samples are known as _____ samples.
A) proportional
B) matched
C) independent
D) pooled
A) proportional
B) matched
C) independent
D) pooled
فتح الحزمة
افتح القفل للوصول البطاقات البالغ عددها 85 في هذه المجموعة.
فتح الحزمة
k this deck
13
Salary information regarding male and female employees of a large company is shown below. If you are interested in testing whether or not the population average salary of males is significantly greater than that of females, at α = .05, the conclusion is that the population
A) average salary of males is significantly greater than females.
B) average salary of males is significantly lower than females.
C) salaries of males and females are equal.
D) average salary of males is greater than females cannot be proved.
If you are interested in testing whether or not the population average salary of males is significantly greater than that of females, at α = .05, the conclusion is that the populationA) average salary of males is significantly greater than females.
B) average salary of males is significantly lower than females.
C) salaries of males and females are equal.
D) average salary of males is greater than females cannot be proved.
فتح الحزمة
افتح القفل للوصول البطاقات البالغ عددها 85 في هذه المجموعة.
فتح الحزمة
k this deck
14
Salary information regarding male and female employees of a large company is shown below. If you are interested in testing whether or not the population average salary of males is significantly greater than that of females at an α = .05, the test statistic is
A) 2.0.
B) 1.5.
C) 1.96.
D) 1.645.
If you are interested in testing whether or not the population average salary of males is significantly greater than that of females at an α = .05, the test statistic isA) 2.0.
B) 1.5.
C) 1.96.
D) 1.645.
فتح الحزمة
افتح القفل للوصول البطاقات البالغ عددها 85 في هذه المجموعة.
فتح الحزمة
k this deck
15
Salary information regarding male and female employees of a large company is shown below. The 95% confidence interval for the difference between the means of the two populations is
A) 0 to 6.92.
B) -2 to 2.
C) -1.96 to 1.96.
D) 0.08 to 7.92.
The 95% confidence interval for the difference between the means of the two populations isA) 0 to 6.92.
B) -2 to 2.
C) -1.96 to 1.96.
D) 0.08 to 7.92.
فتح الحزمة
افتح القفل للوصول البطاقات البالغ عددها 85 في هذه المجموعة.
فتح الحزمة
k this deck
16
Salary information regarding male and female employees of a large company is shown below. The point estimate of the difference between the means of the two populations is
A) -28.
B) 3.
C) 4.
D) -4.
The point estimate of the difference between the means of the two populations isA) -28.
B) 3.
C) 4.
D) -4.
فتح الحزمة
افتح القفل للوصول البطاقات البالغ عددها 85 في هذه المجموعة.
فتح الحزمة
k this deck
17
Two independent simple random samples are taken to test the difference between the means of two populations whose standard deviations are not known, but are assumed to be equal.The sample sizes are n1 = 25 and n2 = 30.The correct distribution to use is the t distribution with _____ degrees of freedom.
A) 57
B) 53
C) 54
D) 56
A) 57
B) 53
C) 54
D) 56
فتح الحزمة
افتح القفل للوصول البطاقات البالغ عددها 85 في هذه المجموعة.
فتح الحزمة
k this deck
18
Salary information regarding male and female employees of a large company is shown below. The standard error of the difference between the two sample means is
A) 4.
B) 7.46.
C) 4.24.
D) 2.0.
The standard error of the difference between the two sample means isA) 4.
B) 7.46.
C) 4.24.
D) 2.0.
فتح الحزمة
افتح القفل للوصول البطاقات البالغ عددها 85 في هذه المجموعة.
فتح الحزمة
k this deck
19
If we are interested in testing whether the proportion of items in population 1 is larger than the proportion of items in population 2, the
A) null hypothesis should state p1 - p2 < 0.
B) alternative hypothesis should state p1 - p2 = 0.
C) alternative hypothesis should state p1 - p2 < 0.
D) alternative hypothesis should state p1 - p2 > 0.
A) null hypothesis should state p1 - p2 < 0.
B) alternative hypothesis should state p1 - p2 = 0.
C) alternative hypothesis should state p1 - p2 < 0.
D) alternative hypothesis should state p1 - p2 > 0.
فتح الحزمة
افتح القفل للوصول البطاقات البالغ عددها 85 في هذه المجموعة.
فتح الحزمة
k this deck
20
To construct an interval estimate for the difference between the means of two populations when the standard deviations of the two populations are unknown and it can be assumed the two populations have equal variances, we must use a t distribution with (let n1 be the size of sample 1 and n2 the size of sample 2) _____ degrees of freedom.
A) (n1 + n2)
B) (n1 + n2 - 1)
C) (n1 + n2 - 2)
D) (n1 - 1)
A) (n1 + n2)
B) (n1 + n2 - 1)
C) (n1 + n2 - 2)
D) (n1 - 1)
فتح الحزمة
افتح القفل للوصول البطاقات البالغ عددها 85 في هذه المجموعة.
فتح الحزمة
k this deck
21
In order to determine whether or not there is a significant difference between the mean hourly wages paid by two companies (of the same industry), the following data have been accumulated. The test statistic is
A) .098.
B) 1.645.
C) 2.75.
D) 3.08.
The test statistic isA) .098.
B) 1.645.
C) 2.75.
D) 3.08.
فتح الحزمة
افتح القفل للوصول البطاقات البالغ عددها 85 في هذه المجموعة.
فتح الحزمة
k this deck
22
A statistics teacher wants to see if there is any difference in the abilities of students enrolled in statistics today and those enrolled five years ago.A sample of final examination scores from students enrolled today and from students enrolled five years ago was taken.You are given the following information. The standard error of - is
A) 12.9.
B) 9.3.
C) 4.
D) 2.
The standard error of - isA) 12.9.
B) 9.3.
C) 4.
D) 2.
فتح الحزمة
افتح القفل للوصول البطاقات البالغ عددها 85 في هذه المجموعة.
فتح الحزمة
k this deck
23
A statistics teacher wants to see if there is any difference in the abilities of students enrolled in statistics today and those enrolled five years ago.A sample of final examination scores from students enrolled today and from students enrolled five years ago was taken.You are given the following information. The test statistic for the difference between the two population means is
A) -.47.
B) -.65.
C) -1.5.
D) -3.0.
The test statistic for the difference between the two population means isA) -.47.
B) -.65.
C) -1.5.
D) -3.0.
فتح الحزمة
افتح القفل للوصول البطاقات البالغ عددها 85 في هذه المجموعة.
فتح الحزمة
k this deck
24
The management of a department store is interested in estimating the difference between the mean credit purchases of customers using the store's credit card versus those customers using a national major credit card.You are given the following information. A point estimate for the difference between the mean purchases of all users of the two credit cards is
A) 20.
B) 2.
C) 260.
D) 15.
A point estimate for the difference between the mean purchases of all users of the two credit cards isA) 20.
B) 2.
C) 260.
D) 15.
فتح الحزمة
افتح القفل للوصول البطاقات البالغ عددها 85 في هذه المجموعة.
فتح الحزمة
k this deck
25
The following information was obtained from matched samples taken from two populations.Assume the population of differences is normally distributed. The point estimate for the difference between the means of the two populations (Method 1 - Method 2) is
A) -1.
B) 0.
C) -4.
D) 2.
The point estimate for the difference between the means of the two populations (Method 1 - Method 2) isA) -1.
B) 0.
C) -4.
D) 2.
فتح الحزمة
افتح القفل للوصول البطاقات البالغ عددها 85 في هذه المجموعة.
فتح الحزمة
k this deck
26
A statistics teacher wants to see if there is any difference in the abilities of students enrolled in statistics today and those enrolled five years ago.A sample of final examination scores from students enrolled today and from students enrolled five years ago was taken.You are given the following information. The p-value for the difference between the two population means is
A) .0013.
B) .0027.
C) .4987.
D) .9987.
The p-value for the difference between the two population means isA) .0013.
B) .0027.
C) .4987.
D) .9987.
فتح الحزمة
افتح القفل للوصول البطاقات البالغ عددها 85 في هذه المجموعة.
فتح الحزمة
k this deck
27
The following information was obtained from independent random samples taken of two populations. Assume normally distributed populations with equal variances.
The 95% confidence interval for the difference between the two population means is (use rounded standard error)
A) -5.344 to 11.344.
B) -5 to 3.
C) -4.86 to 10.86.
D) -2.65 to 8.65.
The 95% confidence interval for the difference between the two population means is (use rounded standard error)
A) -5.344 to 11.344.
B) -5 to 3.
C) -4.86 to 10.86.
D) -2.65 to 8.65.
فتح الحزمة
افتح القفل للوصول البطاقات البالغ عددها 85 في هذه المجموعة.
فتح الحزمة
k this deck
28
In order to determine whether or not there is a significant difference between the mean hourly wages paid by two companies (of the same industry), the following data have been accumulated. A point estimate for the difference between the two population means is
A) 20.
B) .50.
C) .25.
D) 1.00.
A point estimate for the difference between the two population means isA) 20.
B) .50.
C) .25.
D) 1.00.
فتح الحزمة
افتح القفل للوصول البطاقات البالغ عددها 85 في هذه المجموعة.
فتح الحزمة
k this deck
29
The following information was obtained from independent random samples taken of two populations. Assume normally distributed populations with equal variances.
The point estimate for the difference between the means of the two populations is
A) 0.
B) -3.
C) 3.
D) 15.
The point estimate for the difference between the means of the two populations is
A) 0.
B) -3.
C) 3.
D) 15.
فتح الحزمة
افتح القفل للوصول البطاقات البالغ عددها 85 في هذه المجموعة.
فتح الحزمة
k this deck
30
The following information was obtained from independent random samples taken of two populations. Assume normally distributed populations with equal variances.
The standard error of - is
A) 3.0.
B) 4.
C) 8.372.
D) 19.48.
The standard error of
- isA) 3.0.
B) 4.
C) 8.372.
D) 19.48.
فتح الحزمة
افتح القفل للوصول البطاقات البالغ عددها 85 في هذه المجموعة.
فتح الحزمة
k this deck
31
The following information was obtained from matched samples taken from two populations.Assume the population of differences is normally distributed. If the null hypothesis H0: μd = 0 is tested at the 5% level,
A) the null hypothesis should be rejected.
B) the null hypothesis should not be rejected.
C) the alternative hypothesis should be revised.
D) the null hypothesis should be revised.
If the null hypothesis H0: μd = 0 is tested at the 5% level,A) the null hypothesis should be rejected.
B) the null hypothesis should not be rejected.
C) the alternative hypothesis should be revised.
D) the null hypothesis should be revised.
فتح الحزمة
افتح القفل للوصول البطاقات البالغ عددها 85 في هذه المجموعة.
فتح الحزمة
k this deck
32
A statistics teacher wants to see if there is any difference in the abilities of students enrolled in statistics today and those enrolled five years ago.A sample of final examination scores from students enrolled today and from students enrolled five years ago was taken.You are given the following information. The 98% confidence interval for the difference between the two population means is
A) -9.92 to -2.08.
B) -10.66 to -1.34.
C) -13.84 to -1.16.
D) -24.77 to 12.23.
The 98% confidence interval for the difference between the two population means isA) -9.92 to -2.08.
B) -10.66 to -1.34.
C) -13.84 to -1.16.
D) -24.77 to 12.23.
فتح الحزمة
افتح القفل للوصول البطاقات البالغ عددها 85 في هذه المجموعة.
فتح الحزمة
k this deck
33
The management of a department store is interested in estimating the difference between the mean credit purchases of customers using the store's credit card versus those customers using a national major credit card.You are given the following information. A 95% confidence interval estimate for the difference between the average purchases of all customers using the two different credit cards is
A) 13.31 to 16.69.
B) 11.68 to 18.32.
C) 12.22 to 17.78.
D) 16.68 to 23.32.
A 95% confidence interval estimate for the difference between the average purchases of all customers using the two different credit cards isA) 13.31 to 16.69.
B) 11.68 to 18.32.
C) 12.22 to 17.78.
D) 16.68 to 23.32.
فتح الحزمة
افتح القفل للوصول البطاقات البالغ عددها 85 في هذه المجموعة.
فتح الحزمة
k this deck
34
The following information was obtained from independent random samples taken of two populations. Assume normally distributed populations with equal variances.
The degrees of freedom for the t distribution are
A) 22.
B) 10.
C) 24.
D) 20.
The degrees of freedom for the t distribution are
A) 22.
B) 10.
C) 24.
D) 20.
فتح الحزمة
افتح القفل للوصول البطاقات البالغ عددها 85 في هذه المجموعة.
فتح الحزمة
k this deck
35
The following information was obtained from matched samples taken from two populations.Assume the population of differences is normally distributed. The 98% confidence interval for the difference between the two population means is
A) -3.776 to 1.776.
B) -4.747 to 2.747.
C) -1.776 to 2.776.
D) -4.747 to 1.776.
The 98% confidence interval for the difference between the two population means isA) -3.776 to 1.776.
B) -4.747 to 2.747.
C) -1.776 to 2.776.
D) -4.747 to 1.776.
فتح الحزمة
افتح القفل للوصول البطاقات البالغ عددها 85 في هذه المجموعة.
فتح الحزمة
k this deck
36
A statistics teacher wants to see if there is any difference in the abilities of students enrolled in statistics today and those enrolled five years ago.A sample of final examination scores from students enrolled today and from students enrolled five years ago was taken.You are given the following information. What is the conclusion that can be reached about the difference in the average final examination scores between the two classes? (Use a .05 level of significance.)
A) There is a statistically significant difference in the average final examination scores between the two classes.
B) There is no statistically significant difference in the average final examination scores between the two classes.
C) It is impossible to make a decision on the basis of the information given.
D) The students who enrolled in statistics today are the same students who enrolled five years ago.
What is the conclusion that can be reached about the difference in the average final examination scores between the two classes? (Use a .05 level of significance.)A) There is a statistically significant difference in the average final examination scores between the two classes.
B) There is no statistically significant difference in the average final examination scores between the two classes.
C) It is impossible to make a decision on the basis of the information given.
D) The students who enrolled in statistics today are the same students who enrolled five years ago.
فتح الحزمة
افتح القفل للوصول البطاقات البالغ عددها 85 في هذه المجموعة.
فتح الحزمة
k this deck
37
In order to estimate the difference between the average hourly wages of employees of two branches of a department store, the following data have been gathered. A 95% interval estimate for the difference between the two population means is
A) .071 to 1.929.
B) .226 to 1.774.
C) 1.09 to 4.078.
D) 1.078 to 2.922.
A 95% interval estimate for the difference between the two population means isA) .071 to 1.929.
B) .226 to 1.774.
C) 1.09 to 4.078.
D) 1.078 to 2.922.
فتح الحزمة
افتح القفل للوصول البطاقات البالغ عددها 85 في هذه المجموعة.
فتح الحزمة
k this deck
38
The following information was obtained from matched samples taken from two populations.Assume the population of differences is normally distributed. The null hypothesis tested is H0: μd = 0.The test statistic for the difference between the two population means is
A) 2.
B) 0.
C) -1.
D) -2.
The null hypothesis tested is H0: μd = 0.The test statistic for the difference between the two population means isA) 2.
B) 0.
C) -1.
D) -2.
فتح الحزمة
افتح القفل للوصول البطاقات البالغ عددها 85 في هذه المجموعة.
فتح الحزمة
k this deck
39
In order to estimate the difference between the average hourly wages of employees of two branches of a department store, the following data have been gathered. A point estimate for the difference between the two population means is
A) 1.
B) 2.
C) 3.
D) 4.
A point estimate for the difference between the two population means isA) 1.
B) 2.
C) 3.
D) 4.
فتح الحزمة
افتح القفل للوصول البطاقات البالغ عددها 85 في هذه المجموعة.
فتح الحزمة
k this deck
40
The management of a department store is interested in estimating the difference between the mean credit purchases of customers using the store's credit card versus those customers using a national major credit card.You are given the following information. At 95% confidence, the margin of error is
A) 1.694.
B) 3.32.
C) 1.96.
D) 15.
At 95% confidence, the margin of error isA) 1.694.
B) 3.32.
C) 1.96.
D) 15.
فتح الحزمة
افتح القفل للوصول البطاقات البالغ عددها 85 في هذه المجموعة.
فتح الحزمة
k this deck
41
An insurance company selected samples of clients under 18 years of age and over 18 and recorded the number of accidents they had in the previous year.The results are shown below. We are interested in determining if the accident proportions differ between the two age groups.Let pu represent the proportion under and po the proportion over the age of 18.The null hypothesis is
A) pu - po ≤ 0.
B) pu - po ≥ 0.
C) pu - po ≠ 0.
D) pu - po = 0.
We are interested in determining if the accident proportions differ between the two age groups.Let pu represent the proportion under and po the proportion over the age of 18.The null hypothesis isA) pu - po ≤ 0.
B) pu - po ≥ 0.
C) pu - po ≠ 0.
D) pu - po = 0.
فتح الحزمة
افتح القفل للوصول البطاقات البالغ عددها 85 في هذه المجموعة.
فتح الحزمة
k this deck
42
An insurance company selected samples of clients under 18 years of age and over 18 and recorded the number of accidents they had in the previous year.The results are shown below. We are interested in determining if the accident proportions differ between the two age groups.The p-value is
A) less than .001.
B) more than .10.
C) .0228.
D) .3.
We are interested in determining if the accident proportions differ between the two age groups.The p-value isA) less than .001.
B) more than .10.
C) .0228.
D) .3.
فتح الحزمة
افتح القفل للوصول البطاقات البالغ عددها 85 في هذه المجموعة.
فتح الحزمة
k this deck
43
An insurance company selected samples of clients under 18 years of age and over 18 and recorded the number of accidents they had in the previous year.The results are shown below. We are interested in determining if the accident proportions differ between the two age groups.
The pooled estimator of the population proportion is
A) .305.
B) .300.
C) .027.
D) .450.
We are interested in determining if the accident proportions differ between the two age groups.The pooled estimator of the population proportion is
A) .305.
B) .300.
C) .027.
D) .450.
فتح الحزمة
افتح القفل للوصول البطاقات البالغ عددها 85 في هذه المجموعة.
فتح الحزمة
k this deck
44
Two major automobile manufacturers have produced compact cars with engines of the same size.We are interested in determining whether or not there is a significant difference in the mean MPG (miles per gallon) when testing for the fuel efficiency of these two brands of automobiles.A random sample of eight cars from each manufacturer is selected, and eight drivers are selected to drive each automobile for a specified distance.The following data (in miles per gallon) show the results of the test.Assume the population of differences is normally distributed. The mean of the differences is
A) .5.
B) 1.5.
C) 2.0.
D) 2.5.
The mean of the differences isA) .5.
B) 1.5.
C) 2.0.
D) 2.5.
فتح الحزمة
افتح القفل للوصول البطاقات البالغ عددها 85 في هذه المجموعة.
فتح الحزمة
k this deck
45
In hypothesis tests about p1 - p2, the pooled estimator of p is a(n)
A) simple average of and .
B) weighted average of and .
C) geometric average of and .
D) exponential average of and .
A) simple average of
and .B) weighted average of
and .C) geometric average of
and .D) exponential average of
and . فتح الحزمة
افتح القفل للوصول البطاقات البالغ عددها 85 في هذه المجموعة.
فتح الحزمة
k this deck
46
Regarding inferences about the difference between two population means, the sampling design that uses a pooled sample variance in cases of equal population standard deviations is based on
A) research samples.
B) pooled samples.
C) independent samples.
D) conditional samples.
A) research samples.
B) pooled samples.
C) independent samples.
D) conditional samples.
فتح الحزمة
افتح القفل للوصول البطاقات البالغ عددها 85 في هذه المجموعة.
فتح الحزمة
k this deck
47
The results of a recent poll on the preference of shoppers regarding two products are shown below. The point estimate for the difference between the two population proportions in favor of this product is
A) .07.
B) .68.
C) .44.
D) .02.
The point estimate for the difference between the two population proportions in favor of this product isA) .07.
B) .68.
C) .44.
D) .02.
فتح الحزمة
افتح القفل للوصول البطاقات البالغ عددها 85 في هذه المجموعة.
فتح الحزمة
k this deck
48
In order to determine whether or not there is a significant difference between the mean hourly wages paid by two companies (of the same industry), the following data have been accumulated. The p-value is
A) .0010.
B) .0021.
C) .0042.
D) .9990.
The p-value isA) .0010.
B) .0021.
C) .0042.
D) .9990.
فتح الحزمة
افتح القفل للوصول البطاقات البالغ عددها 85 في هذه المجموعة.
فتح الحزمة
k this deck
49
Of the two production methods, a company wants to identify the method with the smaller population mean completion time.One sample of workers is selected and each worker first uses one method and then uses the other method.The sampling procedure being used to collect completion time data is based on
A) worker samples.
B) pooled samples.
C) independent samples.
D) matched samples.
A) worker samples.
B) pooled samples.
C) independent samples.
D) matched samples.
فتح الحزمة
افتح القفل للوصول البطاقات البالغ عددها 85 في هذه المجموعة.
فتح الحزمة
k this deck
50
The results of a recent poll on the preference of shoppers regarding two products are shown below. At 95% confidence, the margin of error is
A) .064.
B) .044.
C) .0225.
D) .025.
At 95% confidence, the margin of error isA) .064.
B) .044.
C) .0225.
D) .025.
فتح الحزمة
افتح القفل للوصول البطاقات البالغ عددها 85 في هذه المجموعة.
فتح الحزمة
k this deck
51
The results of a recent poll on the preference of shoppers regarding two products are shown below. The 95% confidence interval estimate for the difference between the populations favoring the products is
A) -.024 to .064.
B) .6 to .7.
C) -.024 to .7.
D) .046 to .066.
The 95% confidence interval estimate for the difference between the populations favoring the products isA) -.024 to .064.
B) .6 to .7.
C) -.024 to .7.
D) .046 to .066.
فتح الحزمة
افتح القفل للوصول البطاقات البالغ عددها 85 في هذه المجموعة.
فتح الحزمة
k this deck
52
The sampling distribution of - is approximated by a normal distribution if _____ are all greater than or equal to 5.
A) n1p2, p2(1 - n2), n2p1, p1(1 - n1)
B) n1p1, p1(1 - n1), n2p2, p2(1 - n2)
C) n1p2, n1(1 - p2), n2p1, n2(1 - p1)
D) n1p1, n1(1 - p1), n2p2, n2(1 - p2)
- is approximated by a normal distribution if _____ are all greater than or equal to 5.A) n1p2, p2(1 - n2), n2p1, p1(1 - n1)
B) n1p1, p1(1 - n1), n2p2, p2(1 - n2)
C) n1p2, n1(1 - p2), n2p1, n2(1 - p1)
D) n1p1, n1(1 - p1), n2p2, n2(1 - p2)
فتح الحزمة
افتح القفل للوصول البطاقات البالغ عددها 85 في هذه المجموعة.
فتح الحزمة
k this deck
53
Two major automobile manufacturers have produced compact cars with engines of the same size.We are interested in determining whether or not there is a significant difference in the mean MPG (miles per gallon) when testing for the fuel efficiency of these two brands of automobiles.A random sample of eight cars from each manufacturer is selected, and eight drivers are selected to drive each automobile for a specified distance.The following data (in miles per gallon) show the results of the test.Assume the population of differences is normally distributed. At α = .10, the null hypothesis
A) should not be rejected.
B) should be rejected.
C) should be revised.
D) should not be tested.
At α = .10, the null hypothesisA) should not be rejected.
B) should be rejected.
C) should be revised.
D) should not be tested.
فتح الحزمة
افتح القفل للوصول البطاقات البالغ عددها 85 في هذه المجموعة.
فتح الحزمة
k this deck
54
In testing the null hypothesis H0: 1 - ?2 = 0, the computed test statistic is z = -1.66.The corresponding p-value is?
A) ?.0485.
B) ?.0970.
C) ?.9515.
D) ?.9030.
1 - ?2 = 0, the computed test statistic is z = -1.66.The corresponding p-value is?A) ?.0485.
B) ?.0970.
C) ?.9515.
D) ?.9030.
فتح الحزمة
افتح القفل للوصول البطاقات البالغ عددها 85 في هذه المجموعة.
فتح الحزمة
k this deck
55
Two major automobile manufacturers have produced compact cars with engines of the same size.We are interested in determining whether or not there is a significant difference in the mean MPG (miles per gallon) when testing for the fuel efficiency of these two brands of automobiles.A random sample of eight cars from each manufacturer is selected, and eight drivers are selected to drive each automobile for a specified distance.The following data (in miles per gallon) show the results of the test.Assume the population of differences is normally distributed. The test statistic is
A) 1.616.
B) 1.906.
C) 2.096.
D) 2.256.
The test statistic isA) 1.616.
B) 1.906.
C) 2.096.
D) 2.256.
فتح الحزمة
افتح القفل للوصول البطاقات البالغ عددها 85 في هذه المجموعة.
فتح الحزمة
k this deck
56
Generally, the ________ sample procedure for inferences about two population means provides better precision than the _______ sample approach.
A) single, independent
B) independent, pooled
C) matched, independent
D) matched, pooled
A) single, independent
B) independent, pooled
C) matched, independent
D) matched, pooled
فتح الحزمة
افتح القفل للوصول البطاقات البالغ عددها 85 في هذه المجموعة.
فتح الحزمة
k this deck
57
The results of a recent poll on the preference of teenagers regarding the types of music they listen to are shown below. The 95% confidence interval for the difference between the two population proportions is
A) .5 to .52.
B) .48 to .5.
C) .028 to .068.
D) -.068 to .028.
The 95% confidence interval for the difference between the two population proportions isA) .5 to .52.
B) .48 to .5.
C) .028 to .068.
D) -.068 to .028.
فتح الحزمة
افتح القفل للوصول البطاقات البالغ عددها 85 في هذه المجموعة.
فتح الحزمة
k this deck
58
In order to determine whether or not there is a significant difference between the mean hourly wages paid by two companies (of the same industry), the following data have been accumulated. At the 5% level of significance, the null hypothesis
A) should be rejected.
B) should not be rejected.
C) should be revised.
D) should not be tested.
At the 5% level of significance, the null hypothesisA) should be rejected.
B) should not be rejected.
C) should be revised.
D) should not be tested.
فتح الحزمة
افتح القفل للوصول البطاقات البالغ عددها 85 في هذه المجموعة.
فتح الحزمة
k this deck
59
The results of a recent poll on the preference of teenagers regarding the types of music they listen to are shown below. The point estimate of the difference between the two population proportions is
A) -.02.
B) .048.
C) .52.
D) -.5.
The point estimate of the difference between the two population proportions isA) -.02.
B) .048.
C) .52.
D) -.5.
فتح الحزمة
افتح القفل للوصول البطاقات البالغ عددها 85 في هذه المجموعة.
فتح الحزمة
k this deck
60
The results of a recent poll on the preference of shoppers regarding two products are shown below. The standard error of - is
A) .025.
B) .044.
C) .0225.
D) .68.
The standard error of - isA) .025.
B) .044.
C) .0225.
D) .68.
فتح الحزمة
افتح القفل للوصول البطاقات البالغ عددها 85 في هذه المجموعة.
فتح الحزمة
k this deck
61
Using the following data regarding the ages (in years) of full-time and part-time students, develop an interval estimate for the difference between the mean ages of the two populations.Use 95% confidence.The degrees of freedom for the t distribution is 106.
فتح الحزمة
افتح القفل للوصول البطاقات البالغ عددها 85 في هذه المجموعة.
فتح الحزمة
k this deck
62
The following information is given concerning the ACT scores of high school seniors from two local schools.
Develop a 98% confidence interval estimate for the difference between the two population means.Assume the two populations are normally distributed.
Develop a 98% confidence interval estimate for the difference between the two population means.Assume the two populations are normally distributed.
فتح الحزمة
افتح القفل للوصول البطاقات البالغ عددها 85 في هذه المجموعة.
فتح الحزمة
k this deck
63
In a sample of 40 Democrats, 6 opposed the President's foreign policy; while of 50 Republicans, 8 were opposed to his policy.Determine a 90% confidence interval estimate for the difference between the proportions of the opinions of the individuals in the two parties.
فتح الحزمة
افتح القفل للوصول البطاقات البالغ عددها 85 في هذه المجموعة.
فتح الحزمة
k this deck
64
Samples of employees of Companies A and B provided the following information regarding the ages of employees.
Develop a 97% confidence interval for the difference between the average ages of the employees of the two companies.
Develop a 97% confidence interval for the difference between the average ages of the employees of the two companies.
فتح الحزمة
افتح القفل للوصول البطاقات البالغ عددها 85 في هذه المجموعة.
فتح الحزمة
k this deck
65
The following table shows the monthly sales (in units) of six salespersons before and after a bonus plan was introduced.Using α = .05, determine whether the bonus plan has increased sales significantly.Assume the population of differences is normally distributed.(For the following matched samples, let the difference d = After - Before.)
فتح الحزمة
افتح القفل للوصول البطاقات البالغ عددها 85 في هذه المجموعة.
فتح الحزمة
k this deck
66
The business manager of a local health clinic is interested in estimating the difference between the fees for extended office visits in her center and the fees of a newly opened group practice.She gathered the following information regarding the two offices.
Develop a 95% confidence interval estimate for the difference between the average fees of the two offices.
Develop a 95% confidence interval estimate for the difference between the average fees of the two offices.
فتح الحزمة
افتح القفل للوصول البطاقات البالغ عددها 85 في هذه المجموعة.
فتح الحزمة
k this deck
67
The following information was obtained from matched samples regarding the productivity (in units per hour) of four individuals using two different methods of production.
Let d = Method 1 - Method 2.Is there a significant difference between the mean productivity of the two methods? Let α = .05.Assume the population of differences is normally distributed.
Let d = Method 1 - Method 2.Is there a significant difference between the mean productivity of the two methods? Let α = .05.Assume the population of differences is normally distributed.
فتح الحزمة
افتح القفل للوصول البطاقات البالغ عددها 85 في هذه المجموعة.
فتح الحزمة
k this deck
68
A credit company has gathered information regarding the average amount (in $) owed by people under 30 years of age and by people over 30 years by taking independent random samples from both age groups.You are given the following information.
Construct a 95% confidence interval for the difference between the population average amounts owed by the two age groups.
Construct a 95% confidence interval for the difference between the population average amounts owed by the two age groups.
فتح الحزمة
افتح القفل للوصول البطاقات البالغ عددها 85 في هذه المجموعة.
فتح الحزمة
k this deck
69
Independent random samples of managers' yearly salaries (in $1000) taken from governmental and private organizations provided the following information.At a .05 level of significance, test to determine if there is a significant difference between the average salaries of the managers in the two sectors.
فتح الحزمة
افتح القفل للوصول البطاقات البالغ عددها 85 في هذه المجموعة.
فتح الحزمة
k this deck
70
A comparative study of organic and conventionally grown produce was checked for the presence of E.coli.Results are summarized below.Is there a significant difference in the proportion of E.coli in organic vs.conventionally grown produce? Test at α = .10.
فتح الحزمة
افتح القفل للوصول البطاقات البالغ عددها 85 في هذه المجموعة.
فتح الحزمة
k this deck
71
The office of records at a university has stated that the proportion of incoming female students who major in business has increased.A sample of female students taken several years ago is compared with a sample of female students this year.Results are summarized below.Has the proportion increased significantly? Test at α = .10.
فتح الحزمة
افتح القفل للوصول البطاقات البالغ عددها 85 في هذه المجموعة.
فتح الحزمة
k this deck
72
In a random sample of 200 Republicans, 160 opposed the new tax laws; while in a sample of 120 Democrats, 84 opposed.Determine a 95% confidence interval estimate for the difference between the proportions of Republicans and Democrats who opposed this new law.
فتح الحزمة
افتح القفل للوصول البطاقات البالغ عددها 85 في هذه المجموعة.
فتح الحزمة
k this deck
73
The following information is gathered from random samples of day and evening students regarding the number of semester hours they take.
Develop a 95% confidence interval estimate for the difference between the mean semester hours taken by the two groups of students.
Develop a 95% confidence interval estimate for the difference between the mean semester hours taken by the two groups of students.
فتح الحزمة
افتح القفل للوصول البطاقات البالغ عددها 85 في هذه المجموعة.
فتح الحزمة
k this deck
74
The following data present the number of computer units sold per day by a sample of 6 salespersons before and after a bonus plan was implemented.
Using a .05 level of significance, test to see if the bonus plan was effective.That is, did the bonus plan actually increase sales? Assume the population of differences is normally distributed.Let d = After - Before.
Using a .05 level of significance, test to see if the bonus plan was effective.That is, did the bonus plan actually increase sales? Assume the population of differences is normally distributed.Let d = After - Before.
فتح الحزمة
افتح القفل للوصول البطاقات البالغ عددها 85 في هذه المجموعة.
فتح الحزمة
k this deck
75
A potential investor conducted a 144-day survey in each of the North Mall and South Mall theaters in order to determine the difference between the average daily attendance at these two theaters.The North Mall theater averaged 630 patrons per day; while the South Mall theater averaged 598 patrons per day.From past information, it is known that the variance for North Mall is 1000; while the variance for the South Mall is 1304.Develop a 98% confidence interval for the difference between the average daily attendance at the two theaters.
فتح الحزمة
افتح القفل للوصول البطاقات البالغ عددها 85 في هذه المجموعة.
فتح الحزمة
k this deck
76
In order to estimate the difference between the average age of male and female employees at the Young Corporation, the following information was gathered.Develop a 95% confidence interval estimate.
فتح الحزمة
افتح القفل للوصول البطاقات البالغ عددها 85 في هذه المجموعة.
فتح الحزمة
k this deck
77
Test scores on a standardized test from samples of students from two universities are given below.
Provide a 98% confidence interval estimate for the difference between the mean test scores of the two universities.
Provide a 98% confidence interval estimate for the difference between the mean test scores of the two universities.
فتح الحزمة
افتح القفل للوصول البطاقات البالغ عددها 85 في هذه المجموعة.
فتح الحزمة
k this deck
78
The following are the results about the test scores of two samples of students from University A and University B on a national statistics examination.The population standard deviations are also shown below.Develop a 95% confidence interval estimate for the difference between the mean scores of the two populations.
فتح الحزمة
افتح القفل للوصول البطاقات البالغ عددها 85 في هذه المجموعة.
فتح الحزمة
k this deck
79
In a sample of 100 Republicans, 60 favored the President's anti-drug program.While in a sample of 150 Democrats, 84 favored his program.At α = .05, test to see if there is a significant difference in the proportions of the Democrats and the Republicans who favored the President's anti-drug program.
فتح الحزمة
افتح القفل للوصول البطاقات البالغ عددها 85 في هذه المجموعة.
فتح الحزمة
k this deck
80
The results of a recent poll on the preference of voters regarding presidential candidates are shown below.
Using α = .05, test to determine whether or not there is a significant difference between the preferences for the two candidates.
Using α = .05, test to determine whether or not there is a significant difference between the preferences for the two candidates.
فتح الحزمة
افتح القفل للوصول البطاقات البالغ عددها 85 في هذه المجموعة.
فتح الحزمة
k this deck
فتح الحزمة
افتح القفل للوصول البطاقات البالغ عددها 85 في هذه المجموعة.


