Deck 17: Additional Tests for Nominal Data: Chi-Squared Tests
ملء الشاشة (f)
سؤال
سؤال
سؤال
سؤال
سؤال
سؤال
سؤال
In a goodness-of-fit test, suppose that a sample showed that the observed frequency  and expected frequency
  were equal for each cell i. Which of the following best describes the decision for the hypothesis test?
A) Reject Ho at α of 0.05 but retain Ho at α of 0.025.
B) Reject Ho at any level of α.
C) Retain Ho at any level of α.
D) Retain Ho at α of 0.05 but reject Ho at α of 0.025.
and expected frequency were equal for each cell i. Which of the following best describes the decision for the hypothesis test?A) Reject Ho at α of 0.05 but retain Ho at α of 0.025.
B) Reject Ho at any level of α.
C) Retain Ho at any level of α.
D) Retain Ho at α of 0.05 but reject Ho at α of 0.025.
سؤال
Which of the following would be used to analyse the relationship between two categorical variables?
A) Z-test of a population proportion.
B) Chi-squared test of a binomial experiment since .
.
C) A Chi-squared test of a binomial experiment or a Chi-squared test of a contingency table.
D) Chi-squared test of a contingency table.
E) None of these choices are correct.
A) Z-test of a population proportion.
B) Chi-squared test of a binomial experiment since
.C) A Chi-squared test of a binomial experiment or a Chi-squared test of a contingency table.
D) Chi-squared test of a contingency table.
E) None of these choices are correct.
سؤال
سؤال
سؤال
سؤال
Which of the following best describes the approach taken if the expected frequency  for any cell i is less than 5?
A) We must choose another sample of five or more observations.
B) We should use the normal distribution instead of the chi-squared distribution.
C) We should combine the cells such that each observed frequency is 5 or more.
D) We must increase the number of degrees of freedom for the test by 5.
for any cell i is less than 5?A) We must choose another sample of five or more observations.
B) We should use the normal distribution instead of the chi-squared distribution.
C) We should combine the cells such that each observed frequency
is 5 or more.D) We must increase the number of degrees of freedom for the test by 5.
سؤال
سؤال
سؤال
سؤال
سؤال
سؤال
سؤال
Which of the following should be used if we want to conduct a two-tail test of a population proportion?
A) z-test of a population proportion.
B) Chi-squared test of a binomial experiment since .
.
C) the chi-squared test of a contingency table.
D) z-test of a population proportion and Chi-squared test of a binomial experiment since .
.
E) Chi-squared test of a binomial experiment since and the chi-squared test of a contingency table.
A) z-test of a population proportion.
B) Chi-squared test of a binomial experiment since
.C) the chi-squared test of a contingency table.
D) z-test of a population proportion and Chi-squared test of a binomial experiment since
.E) Chi-squared test of a binomial experiment since
and the chi-squared test of a contingency table. سؤال
سؤال
سؤال
سؤال
سؤال
سؤال
سؤال
سؤال
سؤال
Which of the following statements is not correct?
A) The chi-squared distribution is symmetrical.
B) The chi-squared distribution is skewed to the right.
C) All values of the chi-squared distribution are positive.
D) The critical region for a goodness-of-fit test with k categories is >
>
.
A) The chi-squared distribution is symmetrical.
B) The chi-squared distribution is skewed to the right.
C) All values of the chi-squared distribution are positive.
D) The critical region for a goodness-of-fit test with k categories is
>.
سؤال
سؤال
سؤال
سؤال
سؤال
In a chi-squared goodness-of-fit test, if the expected frequencies  and the observed frequencies
  were quite different, which of the following is the best conclusion?
A) Null hypothesis is false, and reject Ho.
B) Null hypothesis is true, and retain Ho.
C) Alternative hypothesis is false, reject HA.
D) Chi-squared distribution is invalid, use t-distribution instead.
and the observed frequencies were quite different, which of the following is the best conclusion?A) Null hypothesis is false, and reject Ho.
B) Null hypothesis is true, and retain Ho.
C) Alternative hypothesis is false, reject HA.
D) Chi-squared distribution is invalid, use t-distribution instead.
سؤال
سؤال
سؤال
سؤال
سؤال
سؤال
سؤال
سؤال
سؤال
سؤال
سؤال
سؤال
سؤال
سؤال
سؤال
سؤال
سؤال
سؤال
سؤال
سؤال
سؤال
سؤال
In a chi-squared test of independence, the value of the test statistic was  15.652, and the critical value at
  was 11.1433. Thus we must reject the null hypothesis at
  .
.
15.652, and the critical value at was 11.1433. Thus we must reject the null hypothesis at . سؤال
سؤال
سؤال
سؤال
سؤال
سؤال
سؤال
Last year, Brand A mobile android phones had 45% of the market, Brand B had 35% and Brand C had 20%. This year the makers of Brand C launched a heavy advertising campaign. A random sample of mobile phone stores shows that of the 10 000 android mobile phones sold, 4350 were Brand A, 3450 were Brand B, and 2200 were Brand C. Has the market changed? Test at  0.05.
0.05.
0.05. سؤال
سؤال
سؤال
If we want to perform a one-tail test for differences between two populations of nominal data with exactly two categories, we must employ the z-test of  .
.
. سؤال
Consider a multinomial experiment involving 100 trials and 4 categories (cells). The observed frequencies resulting from the experiment are shown in the accompanying table.  Use the 5% significance level to test the hypotheses.
H0 : p1 = 0.25, p2 = 0.30, p3 = 0.20, p4 = 0.25.
H1 ;At least two proportions differ from their specified values.
Use the 5% significance level to test the hypotheses.H0 : p1 = 0.25, p2 = 0.30, p3 = 0.20, p4 = 0.25.
H1 ;At least two proportions differ from their specified values.
سؤال
The following data are believed to have come from a normal probability distribution. 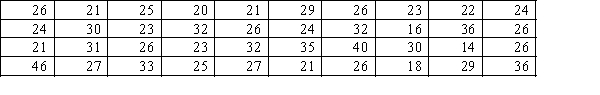 The mean of this sample equals 26.80, and the standard deviation equals 6.378. Use the goodness-of-fit test at the 5% significance level to test this claim.
The mean of this sample equals 26.80, and the standard deviation equals 6.378. Use the goodness-of-fit test at the 5% significance level to test this claim. سؤال
سؤال
If we want to test for differences between two populations of nominal data with exactly two categories, we can employ either the z-test of  , or the chi-squared test of a contingency table. (Squaring the value of the z-statistic yields the value of the
  -statistic.)
, or the chi-squared test of a contingency table. (Squaring the value of the z-statistic yields the value of the -statistic.) سؤال
سؤال
If we want to perform a two-tail test for differences between two populations of nominal data with exactly two categories, we can employ either the z-test of  , or the chi-squared test of a contingency table. (Squaring the value of the z-statistic yields the value of the
  -statistic.)
, or the chi-squared test of a contingency table. (Squaring the value of the z-statistic yields the value of the -statistic.) سؤال
سؤال
سؤال
At present in Australia, voting in a Federal election is compulsory for all citizens 18 years or over.
There has been some discussion to have this changed from being compulsory to voluntary.
A study was done to investigate whether there was a relationship between gender and attitude towards changing voting in Australia from compulsory to voluntary. Participants were asked "Do you agree to change voting in Australian Federal Elections from compulsory to voluntary? A table of results from the sample is given below.
At the 1% level of significance, is there a relationship between gender and attitude towards voluntary voting?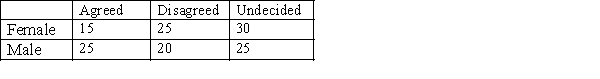
سؤال
سؤال
سؤال
Consider a multinomial experiment involving 160 trials and 4 categories (cells). The observed frequencies resulting from the experiment are shown in the following table.  Use the 10% significance level to test the hypotheses.
 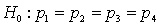 .
.  At least two proportions differ from their specified values.
Use the 10% significance level to test the hypotheses. . At least two proportions differ from their specified values. سؤال
سؤال
سؤال

فتح الحزمة
قم بالتسجيل لفتح البطاقات في هذه المجموعة!
Unlock Deck
Unlock Deck
1/110
العب
ملء الشاشة (f)
Deck 17: Additional Tests for Nominal Data: Chi-Squared Tests
1
Which of the following uses a contingency table?
A) Chi-squared test of independence of two numerical variables in a population.
B) Chi-squared test of independence of two nominal variables in a sample.
C) Chi-squared test of independence of two numerical variables in a sample.
D) Chi-squared test of independence of two nominal variables in a population.
D
2
Which statistical technique is appropriate when we describe a single population of nominal data with exactly two categories?
A) Zz-test of a population proportion.
B) Chi-squared test of a multinomial experiment.
C) Chi-squared test of a contingency table.
D) Z-test of a population proportion and Chi-squared test of a multinomial experiment.
E) Chi-squared test of a multinomial experiment and Chi-squared test of a contingency table.
D
3
Which of the following are the degrees of freedom used in a Chi-squared test of independence between gender and mode of transport to university, if the mode of transport choices are public transport, car, bicycle or other.
A) 8
B) 5
C) 4
D) 3
A) 8
B) 5
C) 4
D) 3
D
4
Which of the following best describes the sampling distribution of the test statistic for a goodness-of-fit test with k categories?
A) Student t-distribution with k - 1 degrees of freedom.
B) Normal distribution.
C) Chi-squared distribution with k - 1 degrees of freedom.
D) Approximately Chi-squared distribution with k - 1 degrees of freedom.
A) Student t-distribution with k - 1 degrees of freedom.
B) Normal distribution.
C) Chi-squared distribution with k - 1 degrees of freedom.
D) Approximately Chi-squared distribution with k - 1 degrees of freedom.
فتح الحزمة
افتح القفل للوصول البطاقات البالغ عددها 110 في هذه المجموعة.
فتح الحزمة
k this deck
5
Which of the following may be used for hypothesis tests of nominal (categorical) data?
A) Chi-squared test of a multinomial experiment.
B) Z test of a population proportion or a Z test for the difference between two population proportions.
C) Chi-squared test of a contingency table.
D) All of these choices are correct.
A) Chi-squared test of a multinomial experiment.
B) Z test of a population proportion or a Z test for the difference between two population proportions.
C) Chi-squared test of a contingency table.
D) All of these choices are correct.
فتح الحزمة
افتح القفل للوصول البطاقات البالغ عددها 110 في هذه المجموعة.
فتح الحزمة
k this deck
6
Which of the following may be used to determine whether data were drawn a particular distribution?
A) Chi-squared goodness-of-fit test.
B) Chi-squared test of a contingency table.
C) Z test.
D) All of these choices are correct.
A) Chi-squared goodness-of-fit test.
B) Chi-squared test of a contingency table.
C) Z test.
D) All of these choices are correct.
فتح الحزمة
افتح القفل للوصول البطاقات البالغ عددها 110 في هذه المجموعة.
فتح الحزمة
k this deck
7
In a goodness-of-fit test, suppose that a sample showed that the observed frequency and expected frequency were equal for each cell i. Which of the following best describes the decision for the hypothesis test?
A) Reject Ho at α of 0.05 but retain Ho at α of 0.025.
B) Reject Ho at any level of α.
C) Retain Ho at any level of α.
D) Retain Ho at α of 0.05 but reject Ho at α of 0.025.
and expected frequency were equal for each cell i. Which of the following best describes the decision for the hypothesis test?A) Reject Ho at α of 0.05 but retain Ho at α of 0.025.
B) Reject Ho at any level of α.
C) Retain Ho at any level of α.
D) Retain Ho at α of 0.05 but reject Ho at α of 0.025.
فتح الحزمة
افتح القفل للوصول البطاقات البالغ عددها 110 في هذه المجموعة.
فتح الحزمة
k this deck
8
Which of the following would be used to analyse the relationship between two categorical variables?
A) Z-test of a population proportion.
B) Chi-squared test of a binomial experiment since .
C) A Chi-squared test of a binomial experiment or a Chi-squared test of a contingency table.
D) Chi-squared test of a contingency table.
E) None of these choices are correct.
A) Z-test of a population proportion.
B) Chi-squared test of a binomial experiment since
.C) A Chi-squared test of a binomial experiment or a Chi-squared test of a contingency table.
D) Chi-squared test of a contingency table.
E) None of these choices are correct.
فتح الحزمة
افتح القفل للوصول البطاقات البالغ عددها 110 في هذه المجموعة.
فتح الحزمة
k this deck
9
Which statistical technique is appropriate when we wish to analyse the relationship between two nominal variables with two or more categories?
A) Chi-squared test of a multinomial experiment.
B) Chi-squared test of a contingency table.
C) t-test of the difference between two means.
D) Z-test of the difference of two means
E) F-test of analysis of variance
A) Chi-squared test of a multinomial experiment.
B) Chi-squared test of a contingency table.
C) t-test of the difference between two means.
D) Z-test of the difference of two means
E) F-test of analysis of variance
فتح الحزمة
افتح القفل للوصول البطاقات البالغ عددها 110 في هذه المجموعة.
فتح الحزمة
k this deck
10
Which of the following best describes a Chi-squared goodness-of-fit test?
A) Two tailed test
B) Left tailed test
C) Right tailed test
D) All of these choices are correct.
A) Two tailed test
B) Left tailed test
C) Right tailed test
D) All of these choices are correct.
فتح الحزمة
افتح القفل للوصول البطاقات البالغ عددها 110 في هذه المجموعة.
فتح الحزمة
k this deck
11
Which of the following best describes the degrees of freedom needed in a Chi-squared test for normality?
A) Number of intervals used to test the hypothesis minus 1.
B) Number of parameters estimated minus 1.
C) Number of intervals used to test the hypothesis minus the number of parameters estimated minus 1.
D) Number of intervals used to test the hypothesis minus the number of parameters estimated minus 2.
فتح الحزمة
افتح القفل للوصول البطاقات البالغ عددها 110 في هذه المجموعة.
فتح الحزمة
k this deck
12
Which of the following best describes the approach taken if the expected frequency for any cell i is less than 5?
A) We must choose another sample of five or more observations.
B) We should use the normal distribution instead of the chi-squared distribution.
C) We should combine the cells such that each observed frequency is 5 or more.
D) We must increase the number of degrees of freedom for the test by 5.
for any cell i is less than 5?A) We must choose another sample of five or more observations.
B) We should use the normal distribution instead of the chi-squared distribution.
C) We should combine the cells such that each observed frequency
is 5 or more.D) We must increase the number of degrees of freedom for the test by 5.
فتح الحزمة
افتح القفل للوصول البطاقات البالغ عددها 110 في هذه المجموعة.
فتح الحزمة
k this deck
13
A chi-squared test of a contingency table with 4 rows and 4 columns shows that the value of the test statistic is 23. Which of the following best describes the p-value for this test?
A) p-value < 0.010
B) p-value < 0.005
C) p-value > 0.10
D) 0.005 < p-value < 0.01
A) p-value < 0.010
B) p-value < 0.005
C) p-value > 0.10
D) 0.005 < p-value < 0.01
فتح الحزمة
افتح القفل للوصول البطاقات البالغ عددها 110 في هذه المجموعة.
فتح الحزمة
k this deck
14
The vice-chancellor of a university collected data from students concerning the building of a new library, and classified the responses into different categories (strongly agree, agree, undecided, disagree, strongly disagree) and according to whether the student was male or female. Which of the following tests should be used to test whether responses and gender are independent?
A) Chi-squared test for goodness-of-fit.
B) Chi-squared test for normality.
C) Chi-square test of a multinomial experiment.
D) Chi-squared test of a contingency table.
A) Chi-squared test for goodness-of-fit.
B) Chi-squared test for normality.
C) Chi-square test of a multinomial experiment.
D) Chi-squared test of a contingency table.
فتح الحزمة
افتح القفل للوصول البطاقات البالغ عددها 110 في هذه المجموعة.
فتح الحزمة
k this deck
15
Which of the following is the correct decision in a goodness-of-fit test, if the calculated value of the test statistic is 20.08 and there are 10 categories, testing at α of 1%?
A) We reject Ho because p-value < 0.01.
B) We retain Ho because p-value < 0.01.
C) We reject Ho because 0.01 < p-value < 0.025.
D) We retain Ho because 0.01 < p-value < 0.025.
A) We reject Ho because p-value < 0.01.
B) We retain Ho because p-value < 0.01.
C) We reject Ho because 0.01 < p-value < 0.025.
D) We retain Ho because 0.01 < p-value < 0.025.
فتح الحزمة
افتح القفل للوصول البطاقات البالغ عددها 110 في هذه المجموعة.
فتح الحزمة
k this deck
16
Which of the following uses the Chi-square distribution?
A) Test of independence between two categorical variables.
B) Test of a multinomial experiment with one categorical variable.
C) Test about a single population variance with one numerical variable.
D) All of these choices are correct.
A) Test of independence between two categorical variables.
B) Test of a multinomial experiment with one categorical variable.
C) Test about a single population variance with one numerical variable.
D) All of these choices are correct.
فتح الحزمة
افتح القفل للوصول البطاقات البالغ عددها 110 في هذه المجموعة.
فتح الحزمة
k this deck
17
Which of the following best describes the number of degrees of freedom used in a Chi-squared test of independence if there is a contingency table with 5 rows and 3 columns?
A) 7
B) 8
C) 15
D) 10
A) 7
B) 8
C) 15
D) 10
فتح الحزمة
افتح القفل للوصول البطاقات البالغ عددها 110 في هذه المجموعة.
فتح الحزمة
k this deck
18
If each element in a population is classified into one and only one of several categories, the population is a:
A) normal population.
B) multinomial population.
C) chi-squared population.
D) binomial population.
A) normal population.
B) multinomial population.
C) chi-squared population.
D) binomial population.
فتح الحزمة
افتح القفل للوصول البطاقات البالغ عددها 110 في هذه المجموعة.
فتح الحزمة
k this deck
19
Which of the following should be used if we want to conduct a two-tail test of a population proportion?
A) z-test of a population proportion.
B) Chi-squared test of a binomial experiment since .
C) the chi-squared test of a contingency table.
D) z-test of a population proportion and Chi-squared test of a binomial experiment since .
E) Chi-squared test of a binomial experiment since and the chi-squared test of a contingency table.
A) z-test of a population proportion.
B) Chi-squared test of a binomial experiment since
.C) the chi-squared test of a contingency table.
D) z-test of a population proportion and Chi-squared test of a binomial experiment since
.E) Chi-squared test of a binomial experiment since
and the chi-squared test of a contingency table. فتح الحزمة
افتح القفل للوصول البطاقات البالغ عددها 110 في هذه المجموعة.
فتح الحزمة
k this deck
20
To determine the critical values in the chi-squared distribution table, the process requires which of the following information?
A) Degrees of freedom.
B) Probability of Type I error.
C) Probability of Type II error.
D) Degrees of freedom and Probability of Type I error.
A) Degrees of freedom.
B) Probability of Type I error.
C) Probability of Type II error.
D) Degrees of freedom and Probability of Type I error.
فتح الحزمة
افتح القفل للوصول البطاقات البالغ عددها 110 في هذه المجموعة.
فتح الحزمة
k this deck
21
A right-tailed area in the chi-squared distribution equals 0.01. For 4 degrees of freedom, the table value equals 13.2767.
فتح الحزمة
افتح القفل للوصول البطاقات البالغ عددها 110 في هذه المجموعة.
فتح الحزمة
k this deck
22
Which statistical technique is appropriate when we compare two populations of nominal data with exactly two categories?
A) The z-test of a population proportion.
B) The z-test of the difference between two proportions.
C) The chi-squared test of a contingency table.
D) The z-test of a population proportion and the z-test of the difference between two proportions.
E) The z-test of the difference between two proportions and the chi-squared test of a contingency table.
فتح الحزمة
افتح القفل للوصول البطاقات البالغ عددها 110 في هذه المجموعة.
فتح الحزمة
k this deck
23
Whenever the expected frequency of a cell is less than 5, we must increase the significance level.
فتح الحزمة
افتح القفل للوصول البطاقات البالغ عددها 110 في هذه المجموعة.
فتح الحزمة
k this deck
24
The null hypothesis states that the sample data came from a normally distributed population. The researcher calculates the sample mean and the sample standard deviation from the data. The data arrangement consisted of seven categories. Using a 0.05 significance level, the appropriate critical value for this chi-squared test for normality is 11.0705.
فتح الحزمة
افتح القفل للوصول البطاقات البالغ عددها 110 في هذه المجموعة.
فتح الحزمة
k this deck
25
Which of the following statements is true for the chi-squared tests?
A) Testing for equal proportions is identical to testing for goodness-of-fit.
B) The number of degrees of freedom in a test of a contingency table with r rows and c columns is (r - 1)(c - 1).
C) The number of degrees of freedom in a goodness-of-fit test with k categories is k - 1.
D) All of these choices are correct.
فتح الحزمة
افتح القفل للوصول البطاقات البالغ عددها 110 في هذه المجموعة.
فتح الحزمة
k this deck
26
Which of the following is not a characteristic of a multinomial experiment?
A) The experiment consists of a fixed number, n, of trials.
B) The outcome of each trial can be classified into one of two categories called success and failure.
C) The probability that the outcome will fall into cell i remain constant for each trial.
D) Each trial of the experiment is independent of the other trials.
فتح الحزمة
افتح القفل للوصول البطاقات البالغ عددها 110 في هذه المجموعة.
فتح الحزمة
k this deck
27
Which of the following best describes the rejection region in a chi-squared test of independence?
A) χ2 > χ2α, (r - 2)(c −2)
B) χ2 > χ2 1−α , (r - 1)(c −1)
C) χ2 > χ2α, (r - 1)(c −1)
D) χ2 < χ2α, (r - 1)(c −1)
E) None of these choices are correct.
A) χ2 > χ2α, (r - 2)(c −2)
B) χ2 > χ2 1−α , (r - 1)(c −1)
C) χ2 > χ2α, (r - 1)(c −1)
D) χ2 < χ2α, (r - 1)(c −1)
E) None of these choices are correct.
فتح الحزمة
افتح القفل للوصول البطاقات البالغ عددها 110 في هذه المجموعة.
فتح الحزمة
k this deck
28
Which of the following statements is not correct?
A) The chi-squared distribution is symmetrical.
B) The chi-squared distribution is skewed to the right.
C) All values of the chi-squared distribution are positive.
D) The critical region for a goodness-of-fit test with k categories is >
.
A) The chi-squared distribution is symmetrical.
B) The chi-squared distribution is skewed to the right.
C) All values of the chi-squared distribution are positive.
D) The critical region for a goodness-of-fit test with k categories is
>.
فتح الحزمة
افتح القفل للوصول البطاقات البالغ عددها 110 في هذه المجموعة.
فتح الحزمة
k this deck
29
A left-tailed area in the chi-squared distribution equals 0.975. For df = 11, the table value equals:
A) 20.4831.
B) 19.6751.
C) 3.81575.
D) 21.9200.
A) 20.4831.
B) 19.6751.
C) 3.81575.
D) 21.9200.
فتح الحزمة
افتح القفل للوصول البطاقات البالغ عددها 110 في هذه المجموعة.
فتح الحزمة
k this deck
30
Which of the following statements is not correct?
A) The chi-squared test of independence is a one-sample test.
B) Both variables in the chi-squared test of independence are nominal variables.
C) The chi-squared goodness-of-fit test involves two categorical variables.
D) The chi-squared distribution is skewed to the right.
A) The chi-squared test of independence is a one-sample test.
B) Both variables in the chi-squared test of independence are nominal variables.
C) The chi-squared goodness-of-fit test involves two categorical variables.
D) The chi-squared distribution is skewed to the right.
فتح الحزمة
افتح القفل للوصول البطاقات البالغ عددها 110 في هذه المجموعة.
فتح الحزمة
k this deck
31
The chi-squared test of a contingency table is based upon:
A) two nominal variables.
B) two numerical variables.
C) three or more nominal variables.
D) three or more numerical variables.
A) two nominal variables.
B) two numerical variables.
C) three or more nominal variables.
D) three or more numerical variables.
فتح الحزمة
افتح القفل للوصول البطاقات البالغ عددها 110 في هذه المجموعة.
فتح الحزمة
k this deck
32
A test for independence is applied to a contingency table with 5 rows and 2 columns for two nominal variables. The number of degrees of freedom for this chi-squared test must be 4.
فتح الحزمة
افتح القفل للوصول البطاقات البالغ عددها 110 في هذه المجموعة.
فتح الحزمة
k this deck
33
In a chi-squared goodness-of-fit test, if the expected frequencies and the observed frequencies were quite different, which of the following is the best conclusion?
A) Null hypothesis is false, and reject Ho.
B) Null hypothesis is true, and retain Ho.
C) Alternative hypothesis is false, reject HA.
D) Chi-squared distribution is invalid, use t-distribution instead.
and the observed frequencies were quite different, which of the following is the best conclusion?A) Null hypothesis is false, and reject Ho.
B) Null hypothesis is true, and retain Ho.
C) Alternative hypothesis is false, reject HA.
D) Chi-squared distribution is invalid, use t-distribution instead.
فتح الحزمة
افتح القفل للوصول البطاقات البالغ عددها 110 في هذه المجموعة.
فتح الحزمة
k this deck
34
In a goodness-of-fit test, the null hypothesis states that the data came from a normally distributed population. The researcher estimated the population mean and population standard deviation from a sample of 500 observations. In addition, the researcher used 6 standardised intervals to test for normality. Using a 5% level of significance, the critical value for this test is:
A) 11.1433.
B) 9.3484.
C) 7.8147.
D) 9.4877.
A) 11.1433.
B) 9.3484.
C) 7.8147.
D) 9.4877.
فتح الحزمة
افتح القفل للوصول البطاقات البالغ عددها 110 في هذه المجموعة.
فتح الحزمة
k this deck
35
Which of the following tests do not use the Chi-squared distribution?
A) Test of a contingency table.
B) Goodness-of-fit test.
C) Test for the difference between two population means.
D) All of these choices are correct.
A) Test of a contingency table.
B) Goodness-of-fit test.
C) Test for the difference between two population means.
D) All of these choices are correct.
فتح الحزمة
افتح القفل للوصول البطاقات البالغ عددها 110 في هذه المجموعة.
فتح الحزمة
k this deck
36
A Chi-squared test can be used to test the equality of two population means.
فتح الحزمة
افتح القفل للوصول البطاقات البالغ عددها 110 في هذه المجموعة.
فتح الحزمة
k this deck
37
A chi-squared test for independence with 6 degrees of freedom results in a test statistic of 13.25. Using the chi-squared table, the most accurate statement that can be made about the p-value for this test is that 0.025 < p-value < 0.05.
فتح الحزمة
افتح القفل للوصول البطاقات البالغ عددها 110 في هذه المجموعة.
فتح الحزمة
k this deck
38
Which statistical technique is appropriate when we compare two or more populations of nominal data with two or more categories?
A) The z-test of the difference between two proportions.
B) The chi-squared test of a multinomial experiment.
C) The chi-squared test of a contingency table.
D) The z-test of the difference between two proportions and the chi-squared test of a multinomial experiment.
E) The chi-squared test of a multinomial experiment and the chi-squared test of a contingency table.
فتح الحزمة
افتح القفل للوصول البطاقات البالغ عددها 110 في هذه المجموعة.
فتح الحزمة
k this deck
39
In a chi-squared test of a contingency table, the value of the test statistic was , the significance level was = 0.05 and the degrees of freedom was 6. Thus:
A) we fail to reject the null hypothesis at = 0.05.
B) we reject the null hypothesis at = 0.05.
C) we don't have enough evidence to accept or reject the null hypothesis at = 0.05.
D) we should increase the level of significance in order to reject the null hypothesis.
A) we fail to reject the null hypothesis at = 0.05.
B) we reject the null hypothesis at = 0.05.
C) we don't have enough evidence to accept or reject the null hypothesis at = 0.05.
D) we should increase the level of significance in order to reject the null hypothesis.
فتح الحزمة
افتح القفل للوصول البطاقات البالغ عددها 110 في هذه المجموعة.
فتح الحزمة
k this deck
40
In chi-squared tests, the conventional and conservative rule - known as the rule of five - is to require that the:
A) expected frequency for each cell be at least 5.
B) number of degrees of freedom for the test be at least 5.
C) each expected and observed frequency be at least 5.
D) difference between the observed and expected frequency for each cell be at least 5.
A) expected frequency for each cell be at least 5.
B) number of degrees of freedom for the test be at least 5.
C) each expected and observed frequency be at least 5.
D) difference between the observed and expected frequency for each cell be at least 5.
فتح الحزمة
افتح القفل للوصول البطاقات البالغ عددها 110 في هذه المجموعة.
فتح الحزمة
k this deck
41
The chi-squared goodness-of-fit test is usually used as a test of multinomial parameters, but it can also be used to determine whether data were drawn from any distribution.
فتح الحزمة
افتح القفل للوصول البطاقات البالغ عددها 110 في هذه المجموعة.
فتح الحزمة
k this deck
42
A chi-squared goodness-of-fit test can be conducted either as a two-tail test or as a one-tail test.
فتح الحزمة
افتح القفل للوصول البطاقات البالغ عددها 110 في هذه المجموعة.
فتح الحزمة
k this deck
43
A multinomial experiment, where the outcome of each trial can be classified into one of two categories, is identical to the binomial experiment.
فتح الحزمة
افتح القفل للوصول البطاقات البالغ عددها 110 في هذه المجموعة.
فتح الحزمة
k this deck
44
For a chi-squared distributed random variable with 12 degrees of freedom and a level of significance of 0.05, the chi-squared value from the table is 21.0261. The computed value of the test statistics is 25.1687. This will lead us to reject the null hypothesis.
فتح الحزمة
افتح القفل للوصول البطاقات البالغ عددها 110 في هذه المجموعة.
فتح الحزمة
k this deck
45
In chi-squared tests, the conventional and conservative rule - known as the rule of five - is to require that difference between the observed and expected frequency for each cell be at least 5.
فتح الحزمة
افتح القفل للوصول البطاقات البالغ عددها 110 في هذه المجموعة.
فتح الحزمة
k this deck
46
Whenever the expected frequency of a cell is less than 5, one possible remedy for this condition is to combine it with one or more other cells.
فتح الحزمة
افتح القفل للوصول البطاقات البالغ عددها 110 في هذه المجموعة.
فتح الحزمة
k this deck
47
A chi-squared test for independence with 10 degrees of freedom results in a test statistic of 17.894. Using the chi-squared table, the most accurate statement that can be made about the p-value for this test is that 0.05 < p-value < 0.10.
فتح الحزمة
افتح القفل للوصول البطاقات البالغ عددها 110 في هذه المجموعة.
فتح الحزمة
k this deck
48
For a chi-squared distributed random variable with 10 degrees of freedom and a level of significance of 0.025, the chi-squared value from the table is 20.5. The computed value of the test statistic is 16.857. The decision is to retain Ho.
فتح الحزمة
افتح القفل للوصول البطاقات البالغ عددها 110 في هذه المجموعة.
فتح الحزمة
k this deck
49
The area to the right of a chi-squared value is 0.01. For 8 degrees of freedom, the table value is 20.0902.
فتح الحزمة
افتح القفل للوصول البطاقات البالغ عددها 110 في هذه المجموعة.
فتح الحزمة
k this deck
50
A left-tailed area in the chi-squared distribution equals 0.10. For 5 degrees of freedom, the table value equals 9.23635.
فتح الحزمة
افتح القفل للوصول البطاقات البالغ عددها 110 في هذه المجموعة.
فتح الحزمة
k this deck
51
A left-tailed area in the chi-squared distribution equals 0.90. For 10 degrees of freedom, the table value equals 15.9871.
فتح الحزمة
افتح القفل للوصول البطاقات البالغ عددها 110 في هذه المجموعة.
فتح الحزمة
k this deck
52
In a goodness-of-fit test, the null hypothesis states that the data came from a normally distributed population. The researcher estimated the population mean and population standard deviation from a sample of 200 observations. In addition, the researcher used 5 standardised intervals to test for normality. Using a 10% level of significance, the critical value for this test is 4.60517.
فتح الحزمة
افتح القفل للوصول البطاقات البالغ عددها 110 في هذه المجموعة.
فتح الحزمة
k this deck
53
A test for independence is applied to a contingency table with 4 rows and 4 columns for two nominal variables. The number of degrees of freedom for this test will be 9.
فتح الحزمة
افتح القفل للوصول البطاقات البالغ عددها 110 في هذه المجموعة.
فتح الحزمة
k this deck
54
The middle 0.95 portion of the chi-squared distribution with 9 degrees of freedom has table values of 3.32511 and 16.9190, respectively.
فتح الحزمة
افتح القفل للوصول البطاقات البالغ عددها 110 في هذه المجموعة.
فتح الحزمة
k this deck
55
In a chi-squared test of independence, the value of the test statistic was 15.652, and the critical value at was 11.1433. Thus we must reject the null hypothesis at .
15.652, and the critical value at was 11.1433. Thus we must reject the null hypothesis at . فتح الحزمة
افتح القفل للوصول البطاقات البالغ عددها 110 في هذه المجموعة.
فتح الحزمة
k this deck
56
In a goodness-of-fit test, the null hypothesis states that the data came from a normally distributed population. The researcher estimated the population mean and population standard deviation from a sample of 100 observations. In addition, the researcher used 6 standardised intervals to test for normality. Using a 2.5% level of significance, the critical value for this test is 9.3484.
فتح الحزمة
افتح القفل للوصول البطاقات البالغ عددها 110 في هذه المجموعة.
فتح الحزمة
k this deck
57
Whenever the expected frequency of a cell is less than 5, one remedy for this condition is to increase the size of the sample.
فتح الحزمة
افتح القفل للوصول البطاقات البالغ عددها 110 في هذه المجموعة.
فتح الحزمة
k this deck
58
The chi-squared test of independence is a Chi-squared test of a contingency table.
فتح الحزمة
افتح القفل للوصول البطاقات البالغ عددها 110 في هذه المجموعة.
فتح الحزمة
k this deck
59
One type of Chi-squared goodness of fit test is a Chi-squared test for normality.
فتح الحزمة
افتح القفل للوصول البطاقات البالغ عددها 110 في هذه المجموعة.
فتح الحزمة
k this deck
60
The rule of five is used to ensure that the discrete distribution of the test statistic can be approximated by the continuous Chi-squared distribution.
فتح الحزمة
افتح القفل للوصول البطاقات البالغ عددها 110 في هذه المجموعة.
فتح الحزمة
k this deck
61
Five brands of orange juice are displayed side by side in several supermarkets in a large city. It was noted that in one day, 180 customers purchased orange juice. Of these, 30 picked Brand A, 40 picked Brand B, 25 picked Brand C, 35 picked Brand D, and 50 picked brand E. In this city, can you conclude at the 5% significance level that there is a preferred brand of orange juice?
فتح الحزمة
افتح القفل للوصول البطاقات البالغ عددها 110 في هذه المجموعة.
فتح الحزمة
k this deck
62
Last year, Brand A mobile android phones had 45% of the market, Brand B had 35% and Brand C had 20%. This year the makers of Brand C launched a heavy advertising campaign. A random sample of mobile phone stores shows that of the 10 000 android mobile phones sold, 4350 were Brand A, 3450 were Brand B, and 2200 were Brand C. Has the market changed? Test at 0.05.
0.05. فتح الحزمة
افتح القفل للوصول البطاقات البالغ عددها 110 في هذه المجموعة.
فتح الحزمة
k this deck
63
When doing a Chi-squared goodness of fit test, we use Ho: The data are not normally distributed.
فتح الحزمة
افتح القفل للوصول البطاقات البالغ عددها 110 في هذه المجموعة.
فتح الحزمة
k this deck
64
The chi-squared test of a contingency table is used to determine if there is enough evidence to infer that two nominal variables are related, and to infer that differences exist among two or more populations of nominal variables.
فتح الحزمة
افتح القفل للوصول البطاقات البالغ عددها 110 في هذه المجموعة.
فتح الحزمة
k this deck
65
If we want to perform a one-tail test for differences between two populations of nominal data with exactly two categories, we must employ the z-test of .
. فتح الحزمة
افتح القفل للوصول البطاقات البالغ عددها 110 في هذه المجموعة.
فتح الحزمة
k this deck
66
Consider a multinomial experiment involving 100 trials and 4 categories (cells). The observed frequencies resulting from the experiment are shown in the accompanying table. Use the 5% significance level to test the hypotheses.
H0 : p1 = 0.25, p2 = 0.30, p3 = 0.20, p4 = 0.25.
H1 ;At least two proportions differ from their specified values.
Use the 5% significance level to test the hypotheses.H0 : p1 = 0.25, p2 = 0.30, p3 = 0.20, p4 = 0.25.
H1 ;At least two proportions differ from their specified values.
فتح الحزمة
افتح القفل للوصول البطاقات البالغ عددها 110 في هذه المجموعة.
فتح الحزمة
k this deck
67
The following data are believed to have come from a normal probability distribution. The mean of this sample equals 26.80, and the standard deviation equals 6.378. Use the goodness-of-fit test at the 5% significance level to test this claim.
The mean of this sample equals 26.80, and the standard deviation equals 6.378. Use the goodness-of-fit test at the 5% significance level to test this claim. فتح الحزمة
افتح القفل للوصول البطاقات البالغ عددها 110 في هذه المجموعة.
فتح الحزمة
k this deck
68
In 2003, the student body of a University in NSW consisted of 30% first-years, 25% second-years, 27% third-years, and 18% fourth-years. A sample of 400 students taken from the 2004 student body showed that there are 138 first-years, 88 second-years, 94 third-years, and 80 fourth-years. Test with 5% significance level to determine whether the student body proportions have changed.
فتح الحزمة
افتح القفل للوصول البطاقات البالغ عددها 110 في هذه المجموعة.
فتح الحزمة
k this deck
69
If we want to test for differences between two populations of nominal data with exactly two categories, we can employ either the z-test of , or the chi-squared test of a contingency table. (Squaring the value of the z-statistic yields the value of the -statistic.)
, or the chi-squared test of a contingency table. (Squaring the value of the z-statistic yields the value of the -statistic.) فتح الحزمة
افتح القفل للوصول البطاقات البالغ عددها 110 في هذه المجموعة.
فتح الحزمة
k this deck
70
Like that of the Student t-distribution, the shape of the chi-squared distribution depends on its number of degrees of freedom.
فتح الحزمة
افتح القفل للوصول البطاقات البالغ عددها 110 في هذه المجموعة.
فتح الحزمة
k this deck
71
If we want to perform a two-tail test for differences between two populations of nominal data with exactly two categories, we can employ either the z-test of , or the chi-squared test of a contingency table. (Squaring the value of the z-statistic yields the value of the -statistic.)
, or the chi-squared test of a contingency table. (Squaring the value of the z-statistic yields the value of the -statistic.) فتح الحزمة
افتح القفل للوصول البطاقات البالغ عددها 110 في هذه المجموعة.
فتح الحزمة
k this deck
72
An Australian firm has been accused of engaging in prejudicial hiring practices against women who have young children, where a young child is defined to be a child less than 12 years of age. According to the most recent census, the percentages of men, women without young children and women with young children in a certain community are 72%, 10% and 18%, respectively. A random sample of 200 employees of the firm revealed that 165 were men, 14 were women without young children and 21 were women with young children. Do the data provide sufficient evidence to conclude at the 10% level of significance that the firm has been engaged in prejudicial hiring practices?
فتح الحزمة
افتح القفل للوصول البطاقات البالغ عددها 110 في هذه المجموعة.
فتح الحزمة
k this deck
73
The personnel manager of a consumer product company asked a random sample of employees how they felt about the work they were doing. The following table gives a breakdown of their responses by gender.
Do the data provide sufficient evidence to conclude that the level of job satisfaction is related to gender? Use 0.10.
Do the data provide sufficient evidence to conclude that the level of job satisfaction is related to gender? Use 0.10.
فتح الحزمة
افتح القفل للوصول البطاقات البالغ عددها 110 في هذه المجموعة.
فتح الحزمة
k this deck
74
At present in Australia, voting in a Federal election is compulsory for all citizens 18 years or over.
There has been some discussion to have this changed from being compulsory to voluntary.
A study was done to investigate whether there was a relationship between gender and attitude towards changing voting in Australia from compulsory to voluntary. Participants were asked "Do you agree to change voting in Australian Federal Elections from compulsory to voluntary? A table of results from the sample is given below.
At the 1% level of significance, is there a relationship between gender and attitude towards voluntary voting?
There has been some discussion to have this changed from being compulsory to voluntary.
A study was done to investigate whether there was a relationship between gender and attitude towards changing voting in Australia from compulsory to voluntary. Participants were asked "Do you agree to change voting in Australian Federal Elections from compulsory to voluntary? A table of results from the sample is given below.
At the 1% level of significance, is there a relationship between gender and attitude towards voluntary voting?
فتح الحزمة
افتح القفل للوصول البطاقات البالغ عددها 110 في هذه المجموعة.
فتح الحزمة
k this deck
75
A university lecturer had the following semester 1 student's final grades for the course that they teach: 8% High Distinction, 35% Distinction, 40% Credit, 12% Pass, and 5% Failed. A sample of 100 second semester final grades for the same course showed 12 High distinctions, 30 Distinctions, 35 Credits, 15 Passes, and 8 Fails. Test at the 10% significance level to determine whether the semester one grades differ significantly from the semester two grades.
فتح الحزمة
افتح القفل للوصول البطاقات البالغ عددها 110 في هذه المجموعة.
فتح الحزمة
k this deck
76
A study of education levels of 500 voters and their political party affiliations in a particular state in Australia showed the following results. Is education level independent of political affiliation? Test at the 5% level of significance.
فتح الحزمة
افتح القفل للوصول البطاقات البالغ عددها 110 في هذه المجموعة.
فتح الحزمة
k this deck
77
Consider a multinomial experiment involving 160 trials and 4 categories (cells). The observed frequencies resulting from the experiment are shown in the following table. Use the 10% significance level to test the hypotheses. . At least two proportions differ from their specified values.
Use the 10% significance level to test the hypotheses. . At least two proportions differ from their specified values. فتح الحزمة
افتح القفل للوصول البطاقات البالغ عددها 110 في هذه المجموعة.
فتح الحزمة
k this deck
78
The number of degrees of freedom for a contingency table with r rows and c columns is (r - 1)(c - 1), provided that both r and c follow the rule of five.
فتح الحزمة
افتح القفل للوصول البطاقات البالغ عددها 110 في هذه المجموعة.
فتح الحزمة
k this deck
79
A sport preference poll showed the following data for men and women:
Using the 5% level of significance, test to determine whether sport preferences depend on gender.
Using the 5% level of significance, test to determine whether sport preferences depend on gender.
فتح الحزمة
افتح القفل للوصول البطاقات البالغ عددها 110 في هذه المجموعة.
فتح الحزمة
k this deck
80
The number of degrees of freedom associated with the chi-squared test for normality is the number of intervals used minus the number of parameters estimated from the data.
فتح الحزمة
افتح القفل للوصول البطاقات البالغ عددها 110 في هذه المجموعة.
فتح الحزمة
k this deck
فتح الحزمة
افتح القفل للوصول البطاقات البالغ عددها 110 في هذه المجموعة.


