Deck 21: Nonparametric Techniques
ملء الشاشة (f)
سؤال
سؤال
سؤال
In a Wilcoxon signed rank sum test, the test statistic is calculated as T = 45. The alternative hypothesis is stated as: The location of population 1 is different from the location of population 2. If there are n = 15 observations for which  , and the 5% significance level is used, then:
A) the null hypothesis will be rejected.
B) the null hypothesis will not be rejected.
C) the test results are inconclusive.
D) the normal approximation must be used.
, and the 5% significance level is used, then:A) the null hypothesis will be rejected.
B) the null hypothesis will not be rejected.
C) the test results are inconclusive.
D) the normal approximation must be used.
سؤال
سؤال
سؤال
سؤال
In a Wilcoxon signed rank sum test, the test statistic is calculated as T = 75. If there are n = 15 observations for which  , and a two-tail test is performed at the 5% significance level, then:
A) we reject the null hypothesis.
B) we don't reject the null hypothesis.
C) the test results are inconclusive.
D) we perform a parametric test.
, and a two-tail test is performed at the 5% significance level, then:A) we reject the null hypothesis.
B) we don't reject the null hypothesis.
C) the test results are inconclusive.
D) we perform a parametric test.
سؤال
سؤال
سؤال
سؤال
سؤال
سؤال
سؤال
سؤال
سؤال
سؤال
سؤال
سؤال
Which of the following is the non-parametric equivalent to the parametric t-test of  for matched pairs?
A) Wilcoxon rank sum test
B) Kruskal-Wallis test
C) Sign test
D) Wilcoxon signed rank sum test
for matched pairs?A) Wilcoxon rank sum test
B) Kruskal-Wallis test
C) Sign test
D) Wilcoxon signed rank sum test
سؤال
سؤال
سؤال
سؤال
سؤال
سؤال
سؤال
In a Wilcoxon rank sum test, the two sample sizes are 6 and 6, and the value of the Wilcoxon test statistic is T = 20. If the test is two-tailed and the level of significance is  , then:
A) the null hypothesis will be rejected.
B) the null hypothesis will not be rejected.
C) the alternative hypothesis will not be rejected.
D) not enough information has been given to answer this question.
, then:A) the null hypothesis will be rejected.
B) the null hypothesis will not be rejected.
C) the alternative hypothesis will not be rejected.
D) not enough information has been given to answer this question.
سؤال
سؤال
سؤال
سؤال
سؤال
سؤال
سؤال
سؤال
سؤال
سؤال
سؤال
سؤال
سؤال
سؤال
سؤال
سؤال
سؤال
سؤال
سؤال
سؤال
سؤال
سؤال
سؤال
سؤال
سؤال
سؤال
سؤال
سؤال
سؤال
سؤال
سؤال
سؤال
سؤال
سؤال
سؤال
Radio advertising is big business, second only to television advertising. The objective for radio advertisements is to get listeners to remember as much as possible about the product/service being advertised. The advertising executive of a large company must decide between two pitched radio advertisements for their company. In order to ascertain the general public's perception, 12 randomly chosen people are selected to listen to both potential advertisements and are then asked a series of 5 questions regarding the radio advertisement's content. The number of correct responses are recorded and listed below. Assume that responses are non-normal. 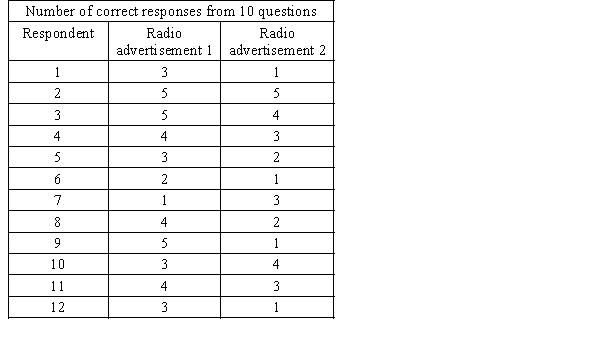 a. Which test is appropriate for this situation?
b. Do these data provide enough evidence at the 5% significance level to conclude that the two radio advertisements differ?
a. Which test is appropriate for this situation?b. Do these data provide enough evidence at the 5% significance level to conclude that the two radio advertisements differ?
سؤال
Use the 5% significance level to test the hypotheses.  The two population locations are the same
  The two population locations are different,
given that the data below are drawn from a matched pair experiment.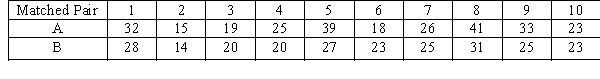
The two population locations are the same The two population locations are different,given that the data below are drawn from a matched pair experiment.
سؤال
سؤال
سؤال
سؤال
In testing the hypotheses:  The two population locations are the same
  The two population locations are different,
with data drawn from two independent samples, the following statistics are calculated: ,
,  ,
,  ,
,  .
.
a. Which test is used for testing the hypotheses above?
b. What is the p-value of this test?
The two population locations are the same The two population locations are different,with data drawn from two independent samples, the following statistics are calculated:
, , , .a. Which test is used for testing the hypotheses above?
b. What is the p-value of this test?
سؤال
The following data were generated from a randomised blocked experiment. Conduct a Friedman test at the 5% significance level to determine if at least two population locations differ. 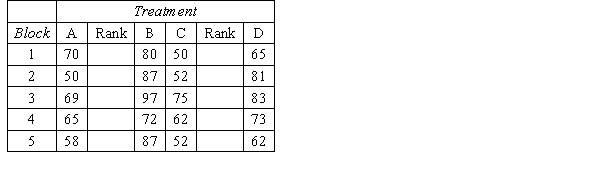
سؤال
Perform the Wilcoxon signed rank sum test for the following matched pairs to determine at the 10% significance level whether the two population locations differ. 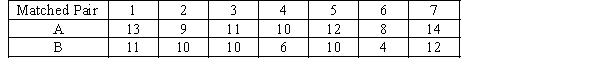
سؤال
In testing the hypotheses
H0: The two population locations are the same
H1: The location of population A is to the left of the location of population B,
with data drawn from two independent samples, the following statistics are calculated: ,
,  ,
,  ,
,  .
.
a. Which test is used for testing the hypotheses above?
b. What is the p-value of this test?
H0: The two population locations are the same
H1: The location of population A is to the left of the location of population B,
with data drawn from two independent samples, the following statistics are calculated:
, , , .a. Which test is used for testing the hypotheses above?
b. What is the p-value of this test?
سؤال
سؤال
Given the following statistics from a matched pairs experiment, perform the Wilcoxon signed rank sum test to determine whether we can infer at the 10% significance level that the two population locations differ. 
 , n = 50
, n = 50 سؤال
سؤال
سؤال
The following data represent the test scores of eight students on a statistics test before and after attending extra help sessions for the test. 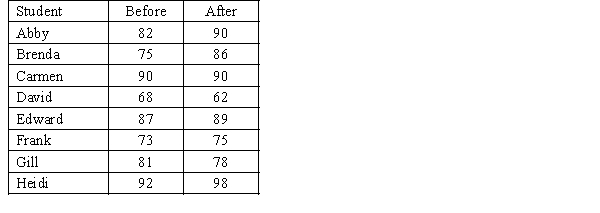 Uses the Wilcoxon signed rank sum test to determine at the 5% significance level whether the extra help sessions have been effective.
Uses the Wilcoxon signed rank sum test to determine at the 5% significance level whether the extra help sessions have been effective. سؤال
Given the following statistics, use the Wilcoxon rank sum test to determine at the 5% significance whether the location of population A is to the right of the location of population B.  ,
,  ,
,  ,
,  .
.
, , , . سؤال
Use the Wilcoxon rank sum test on the data below to determine at the 5% significance level whether the location of population A is to the left of the location of population B. 
سؤال
Each year the personnel department in a large corporation assesses the performance of all of its employees. Each employee is rated for various aspects of his or her job on a 7-point scale where
1 = very unsatisfactory and 7 = satisfactory. The president of the company believes that the assessment scores this year are lower than last year's. To examine the validity of this belief, she draws a random sample of six employees' scores from last year and another six employees' scores this year. Do the data listed below allow the president to conclude at the 5% significance level that her belief is correct?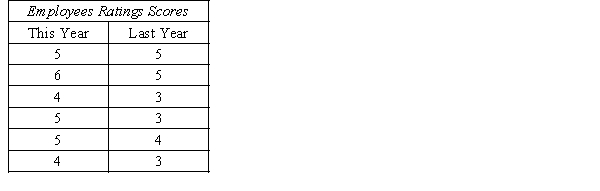
1 = very unsatisfactory and 7 = satisfactory. The president of the company believes that the assessment scores this year are lower than last year's. To examine the validity of this belief, she draws a random sample of six employees' scores from last year and another six employees' scores this year. Do the data listed below allow the president to conclude at the 5% significance level that her belief is correct?
سؤال
سؤال
سؤال

فتح الحزمة
قم بالتسجيل لفتح البطاقات في هذه المجموعة!
Unlock Deck
Unlock Deck
1/126
العب
ملء الشاشة (f)
Deck 21: Nonparametric Techniques
1
In a Kruskal-Wallis test there are five samples and the value of the test statistic is calculated as H = 11.15. The most accurate statement that can be made about the p-value is that:
A) it is smaller than 0.01.
B) it is greater than 0.025 but smaller than 0.05.
C) it is greater than 0.01 but smaller than 0.025.
D) it is greater than 0.05.
A) it is smaller than 0.01.
B) it is greater than 0.025 but smaller than 0.05.
C) it is greater than 0.01 but smaller than 0.025.
D) it is greater than 0.05.
C
2
The appropriate measure of central location of ordinal data is the:
A) mean.
B) median.
C) mode.
D) All these choices are correct.
A) mean.
B) median.
C) mode.
D) All these choices are correct.
B
3
In a Wilcoxon signed rank sum test, the test statistic is calculated as T = 45. The alternative hypothesis is stated as: The location of population 1 is different from the location of population 2. If there are n = 15 observations for which , and the 5% significance level is used, then:
A) the null hypothesis will be rejected.
B) the null hypothesis will not be rejected.
C) the test results are inconclusive.
D) the normal approximation must be used.
, and the 5% significance level is used, then:A) the null hypothesis will be rejected.
B) the null hypothesis will not be rejected.
C) the test results are inconclusive.
D) the normal approximation must be used.
B
4
In a Wilcoxon signed rank sum test for matched pairs with n = 35, the rank sums of the positive and negative differences are 380 and 225, respectively. The value of the standardised test statistic z is:
A) 1.689.
B) 1.065.
C) 1.206.
D) 1.400.
A) 1.689.
B) 1.065.
C) 1.206.
D) 1.400.
فتح الحزمة
افتح القفل للوصول البطاقات البالغ عددها 126 في هذه المجموعة.
فتح الحزمة
k this deck
5
In a normal approximation to the Wilcoxon signed rank sum test, the test statistic is calculated as z = 1.59. For a two-tail test, the p-value is:
A) 0.3882.
B) 0.0559.
C) 0.1118.
D) 0.4441.
A) 0.3882.
B) 0.0559.
C) 0.1118.
D) 0.4441.
فتح الحزمة
افتح القفل للوصول البطاقات البالغ عددها 126 في هذه المجموعة.
فتح الحزمة
k this deck
6
A non-parametric method to compare two populations, when the samples consist of matched pairs of observations and the data are either ordinal or interval, and where the normality requirement necessary to perform the parametric test is not satisfied, is the:
A) Wilcoxon rank sum test.
B) Chi-squared test.
C) Wilcoxon signed rank sum test.
D) Kruskal-Wallis test.
A) Wilcoxon rank sum test.
B) Chi-squared test.
C) Wilcoxon signed rank sum test.
D) Kruskal-Wallis test.
فتح الحزمة
افتح القفل للوصول البطاقات البالغ عددها 126 في هذه المجموعة.
فتح الحزمة
k this deck
7
In a Wilcoxon signed rank sum test, the test statistic is calculated as T = 75. If there are n = 15 observations for which , and a two-tail test is performed at the 5% significance level, then:
A) we reject the null hypothesis.
B) we don't reject the null hypothesis.
C) the test results are inconclusive.
D) we perform a parametric test.
, and a two-tail test is performed at the 5% significance level, then:A) we reject the null hypothesis.
B) we don't reject the null hypothesis.
C) the test results are inconclusive.
D) we perform a parametric test.
فتح الحزمة
افتح القفل للوصول البطاقات البالغ عددها 126 في هذه المجموعة.
فتح الحزمة
k this deck
8
The Kruskal-Wallis test statistic can be approximated by a Chi-squared distribution with k - 1 degrees of freedom (where k is the number of populations) whenever the sample sizes are all greater than or equal to:
A) 30
B) 20
C) 10
D) 5
A) 30
B) 20
C) 10
D) 5
فتح الحزمة
افتح القفل للوصول البطاقات البالغ عددها 126 في هذه المجموعة.
فتح الحزمة
k this deck
9
A non-parametric method to compare two populations, when the samples are independent but the assumptions behind the independent samples t-test are violated, is the:
A) Wilcoxon rank sum test.
B) sign test.
C) matched pairs t-test.
D) Wilcoxon signed rank sum test.
A) Wilcoxon rank sum test.
B) sign test.
C) matched pairs t-test.
D) Wilcoxon signed rank sum test.
فتح الحزمة
افتح القفل للوصول البطاقات البالغ عددها 126 في هذه المجموعة.
فتح الحزمة
k this deck
10
Which of the following is the correct sample size requirement for the Wilcoxon signed rank sum test statistic to be approximately normally distributed?
A) Sample sizes less than 10.
B) Sample sizes greater than 30.
C) Sample sizes greater than 5.
D) Sample sizes greater than 100.
A) Sample sizes less than 10.
B) Sample sizes greater than 30.
C) Sample sizes greater than 5.
D) Sample sizes greater than 100.
فتح الحزمة
افتح القفل للوصول البطاقات البالغ عددها 126 في هذه المجموعة.
فتح الحزمة
k this deck
11
In a Friedman test for comparing four populations, provided that there are eight blocks, the test statistic is calculated as F = 10.98. If the test is conducted at the 5% significance level, the conclusion and p-value will be:
A) reject the null hypothesis, and 0.01 < p-value < 0.025.
B) reject the null hypothesis, and p-value > 0.025.
C) do not reject the null hypothesis, and 0.025 < p-value < 0.05.
D) do not reject the null hypothesis, and p-value > 0.05.
A) reject the null hypothesis, and 0.01 < p-value < 0.025.
B) reject the null hypothesis, and p-value > 0.025.
C) do not reject the null hypothesis, and 0.025 < p-value < 0.05.
D) do not reject the null hypothesis, and p-value > 0.05.
فتح الحزمة
افتح القفل للوصول البطاقات البالغ عددها 126 في هذه المجموعة.
فتح الحزمة
k this deck
12
Which of the following tests would be an example of a non-parametric method?
A) Wilcoxon signed rank sum test.
B) Kruskal-Wallis test.
C) Friedman test.
D) All these choices are correct.
A) Wilcoxon signed rank sum test.
B) Kruskal-Wallis test.
C) Friedman test.
D) All these choices are correct.
فتح الحزمة
افتح القفل للوصول البطاقات البالغ عددها 126 في هذه المجموعة.
فتح الحزمة
k this deck
13
In a Kruskal-Wallis test for comparing five populations, the test statistic is calculated as H = 10.20. If the test is conducted at the 1% significance level, then:
A) the null hypothesis will be rejected.
B) the null hypothesis will not be rejected.
C) the test results are inconclusive.
D) the t-test for matched pairs must be used.
A) the null hypothesis will be rejected.
B) the null hypothesis will not be rejected.
C) the test results are inconclusive.
D) the t-test for matched pairs must be used.
فتح الحزمة
افتح القفل للوصول البطاقات البالغ عددها 126 في هذه المجموعة.
فتح الحزمة
k this deck
14
Which of the following distributions approximates the Kruskal-Wallis test statistic H when the problem objective is to compare k distributions and the sample sizes are greater than or equal to 5?
A) Normal.
B) Chi-squared distribution with k - 1 degrees of freedom.
C) Student t-distribution with k - 2 degrees of freedom.
D) Either chi-squared distribution with k - 5 degrees of freedom or Student t-distribution with k + 5 degrees of freedom.
A) Normal.
B) Chi-squared distribution with k - 1 degrees of freedom.
C) Student t-distribution with k - 2 degrees of freedom.
D) Either chi-squared distribution with k - 5 degrees of freedom or Student t-distribution with k + 5 degrees of freedom.
فتح الحزمة
افتح القفل للوصول البطاقات البالغ عددها 126 في هذه المجموعة.
فتح الحزمة
k this deck
15
Which of the following statements is correct regarding the Kruskal-Wallis test?
A) The Kruskal-Wallis test uses data that are ordinal or numerical and normal.
B) The Kruskal-Wallis test uses data that is numerical and normal.
C) The Kruskal-Wallis test uses data that are ordinal or numerical and non-normal.
D) None of these choices are correct.
A) The Kruskal-Wallis test uses data that are ordinal or numerical and normal.
B) The Kruskal-Wallis test uses data that is numerical and normal.
C) The Kruskal-Wallis test uses data that are ordinal or numerical and non-normal.
D) None of these choices are correct.
فتح الحزمة
افتح القفل للوصول البطاقات البالغ عددها 126 في هذه المجموعة.
فتح الحزمة
k this deck
16
A non-parametric method to compare two or more populations, when the samples are matched pairs and the data are either ordinal or interval but not normal, is the:
A) Wilcoxon signed rank sum test.
B) sign test.
C) Friedman test.
D) Kruskal-Wallis test.
A) Wilcoxon signed rank sum test.
B) sign test.
C) Friedman test.
D) Kruskal-Wallis test.
فتح الحزمة
افتح القفل للوصول البطاقات البالغ عددها 126 في هذه المجموعة.
فتح الحزمة
k this deck
17
A Wilcoxon rank sum test for comparing two populations involves two independent samples of sizes 15 and 20. The unstandardised test statistic (that is the rank sum) is T = 210. The value of the standardised test statistic z is:
A) 14.0.
B) 10.5.
C) 6.0.
D) -2.0.
A) 14.0.
B) 10.5.
C) 6.0.
D) -2.0.
فتح الحزمة
افتح القفل للوصول البطاقات البالغ عددها 126 في هذه المجموعة.
فتح الحزمة
k this deck
18
A non-parametric method to compare two populations, when the samples are matched pairs and the data are ordinal, is the:
A) Wilcoxon signed rank sum test.
B) sign test.
C) Wilcoxon rank sum test.
D) matched pairs t-test.
A) Wilcoxon signed rank sum test.
B) sign test.
C) Wilcoxon rank sum test.
D) matched pairs t-test.
فتح الحزمة
افتح القفل للوصول البطاقات البالغ عددها 126 في هذه المجموعة.
فتح الحزمة
k this deck
19
Which of the following is the non-parametric equivalent to the parametric t-test of for matched pairs?
A) Wilcoxon rank sum test
B) Kruskal-Wallis test
C) Sign test
D) Wilcoxon signed rank sum test
for matched pairs?A) Wilcoxon rank sum test
B) Kruskal-Wallis test
C) Sign test
D) Wilcoxon signed rank sum test
فتح الحزمة
افتح القفل للوصول البطاقات البالغ عددها 126 في هذه المجموعة.
فتح الحزمة
k this deck
20
Which of the following is the alternative hypothesis tested in applications of the Kruskal-Wallis test?
A) At least two population locations are the same.
B) The locations of all k populations differ.
C) At least two population locations differ.
D) The locations of all k populations are the same.
A) At least two population locations are the same.
B) The locations of all k populations differ.
C) At least two population locations differ.
D) The locations of all k populations are the same.
فتح الحزمة
افتح القفل للوصول البطاقات البالغ عددها 126 في هذه المجموعة.
فتح الحزمة
k this deck
21
Which of the following best describes when to apply the Friedman test to determine whether the locations of two or more populations are the same?
A) The populations must be normally distributed.
B) The sample sizes must be at least 30.
C) The data must be generated from a randomised block experiment.
D) All of these choices are correct.
A) The populations must be normally distributed.
B) The sample sizes must be at least 30.
C) The data must be generated from a randomised block experiment.
D) All of these choices are correct.
فتح الحزمة
افتح القفل للوصول البطاقات البالغ عددها 126 في هذه المجموعة.
فتح الحزمة
k this deck
22
In the sign test applications, the normal approximation to the binomial distribution may be used whenever the number of nonzero differences is greater than or equal to:
A) 5
B) 20
C) 10
D) 30
A) 5
B) 20
C) 10
D) 30
فتح الحزمة
افتح القفل للوصول البطاقات البالغ عددها 126 في هذه المجموعة.
فتح الحزمة
k this deck
23
Which of the following best describes when to apply the Wilcoxon rank sum test to determine whether the location of population 1 is different from the location of population 2?
A) The samples must be drawn from normal populations.
B) The samples must be independent.
C) The samples must be drawn from matched pairs experiment.
D) The sample size must be larger than 30.
A) The samples must be drawn from normal populations.
B) The samples must be independent.
C) The samples must be drawn from matched pairs experiment.
D) The sample size must be larger than 30.
فتح الحزمة
افتح القفل للوصول البطاقات البالغ عددها 126 في هذه المجموعة.
فتح الحزمة
k this deck
24
Compared to parametric tests, non-parametric tests use the information contained in the data:
A) more effectively.
B) less effectively.
C) about the same.
D) None of these choices are correct.
A) more effectively.
B) less effectively.
C) about the same.
D) None of these choices are correct.
فتح الحزمة
افتح القفل للوصول البطاقات البالغ عددها 126 في هذه المجموعة.
فتح الحزمة
k this deck
25
Which of the following will never be a required condition of a non-parametric test?
A) The data are ordinal.
B) The samples are drawn from unimodal and symmetrically distributed populations.
C) The data are interval.
D) The populations being compared are identical in spread and shape.
A) The data are ordinal.
B) The samples are drawn from unimodal and symmetrically distributed populations.
C) The data are interval.
D) The populations being compared are identical in spread and shape.
فتح الحزمة
افتح القفل للوصول البطاقات البالغ عددها 126 في هذه المجموعة.
فتح الحزمة
k this deck
26
In a Wilcoxon rank sum test, the two sample sizes are 6 and 6, and the value of the Wilcoxon test statistic is T = 20. If the test is two-tailed and the level of significance is , then:
A) the null hypothesis will be rejected.
B) the null hypothesis will not be rejected.
C) the alternative hypothesis will not be rejected.
D) not enough information has been given to answer this question.
, then:A) the null hypothesis will be rejected.
B) the null hypothesis will not be rejected.
C) the alternative hypothesis will not be rejected.
D) not enough information has been given to answer this question.
فتح الحزمة
افتح القفل للوصول البطاقات البالغ عددها 126 في هذه المجموعة.
فتح الحزمة
k this deck
27
In a normal approximation to the sign test, the standardised test statistic is calculated as z = -1.58. To test the alternative hypothesis that the location of population 1 is to left of the location of population 2, the p-value is:
A) 0.1142.
B) 0.2215.
C) 0.0571.
D) 0.2284.
A) 0.1142.
B) 0.2215.
C) 0.0571.
D) 0.2284.
فتح الحزمة
افتح القفل للوصول البطاقات البالغ عددها 126 في هذه المجموعة.
فتح الحزمة
k this deck
28
The F-test of the randomised block design of the analysis of variance requires that the random variable of interest must be normally distributed and the population variances must be equal. When the random variable is not normally distributed, we can use:
A) one-way ANOVA.
B) two-way ANOVA.
C) the chi-squared test.
D) the Friedman test.
A) one-way ANOVA.
B) two-way ANOVA.
C) the chi-squared test.
D) the Friedman test.
فتح الحزمة
افتح القفل للوصول البطاقات البالغ عددها 126 في هذه المجموعة.
فتح الحزمة
k this deck
29
The non-parametric counterpart of the randomised block model of the analysis of variance is the:
A) Kruskal-Wallis test.
B) Friedman test.
C) Wilcoxon rank sum test.
D) Wilcoxon signed rank sum test.
A) Kruskal-Wallis test.
B) Friedman test.
C) Wilcoxon rank sum test.
D) Wilcoxon signed rank sum test.
فتح الحزمة
افتح القفل للوصول البطاقات البالغ عددها 126 في هذه المجموعة.
فتح الحزمة
k this deck
30
The Wilcoxon rank sum test (like most of the non-parametric tests presented in your textbook) actually tests to determine whether the population distributions have identical:
A) locations.
B) spreads (variances).
C) shapes.
D) All of the above are correct answers.
A) locations.
B) spreads (variances).
C) shapes.
D) All of the above are correct answers.
فتح الحزمة
افتح القفل للوصول البطاقات البالغ عددها 126 في هذه المجموعة.
فتح الحزمة
k this deck
31
A non-parametric test is one that makes no assumptions about the specific shape of the population from which a sample is drawn.
فتح الحزمة
افتح القفل للوصول البطاقات البالغ عددها 126 في هذه المجموعة.
فتح الحزمة
k this deck
32
In a normal approximation to the Wilcoxon rank sum test, the standardised test statistic is calculated as z = 1.80. For a two- tail test, the p-value is:
A) 0.0359.
B) 0.4641.
C) 0.2321.
D) 0.0718.
A) 0.0359.
B) 0.4641.
C) 0.2321.
D) 0.0718.
فتح الحزمة
افتح القفل للوصول البطاقات البالغ عددها 126 في هذه المجموعة.
فتح الحزمة
k this deck
33
Which of the following are statistical methods that require few assumptions, if any, about the distribution of the population?
A) Parametric techniques.
B) Inferential statistics
C) Non-parametric techniques.
D) All of these choices are correct.
A) Parametric techniques.
B) Inferential statistics
C) Non-parametric techniques.
D) All of these choices are correct.
فتح الحزمة
افتح القفل للوصول البطاقات البالغ عددها 126 في هذه المجموعة.
فتح الحزمة
k this deck
34
The non-parametric counterpart of the parametric one-way analysis of variance F-test is the:
A) Kruskal-Wallis test.
B) Friedman test.
C) Wilcoxon rank sum test.
D) Wilcoxon signed rank sum test.
A) Kruskal-Wallis test.
B) Friedman test.
C) Wilcoxon rank sum test.
D) Wilcoxon signed rank sum test.
فتح الحزمة
افتح القفل للوصول البطاقات البالغ عددها 126 في هذه المجموعة.
فتح الحزمة
k this deck
35
The first step in a Wilcoxon rank sum test is to combine the data values in the two samples and assign a rank of 1 to the:
A) smallest observation.
B) middle observation.
C) largest observation.
D) observation that occurs most frequently.
A) smallest observation.
B) middle observation.
C) largest observation.
D) observation that occurs most frequently.
فتح الحزمة
افتح القفل للوصول البطاقات البالغ عددها 126 في هذه المجموعة.
فتح الحزمة
k this deck
36
The non-parametric tests discussed in your textbook (Wilcoxon rank sum test, sign test, Wilcoxon signed rank sum test, Kruskal-Wallis test and Friedman test) all require that the probability distributions be:
A) identical except with respect to location.
B) identical except with respect to spread (variance).
C) identical except with respect to shape (distribution).
D) different with respect to location, spread, and shape.
A) identical except with respect to location.
B) identical except with respect to spread (variance).
C) identical except with respect to shape (distribution).
D) different with respect to location, spread, and shape.
فتح الحزمة
افتح القفل للوصول البطاقات البالغ عددها 126 في هذه المجموعة.
فتح الحزمة
k this deck
37
Which of the following best describes the hypotheses in the Kruskal-Wallis test and Friedman test?
A) Two-tailed.
B) One-tailed.
C) Based on one sample.
D) None of these choices are correct.
A) Two-tailed.
B) One-tailed.
C) Based on one sample.
D) None of these choices are correct.
فتح الحزمة
افتح القفل للوصول البطاقات البالغ عددها 126 في هذه المجموعة.
فتح الحزمة
k this deck
38
A non-parametric method to compare two or more populations, when the samples are independent and the data are either ordinal or interval but not normal, is the:
A) Kruskal-Wallis test.
B) Friedman test.
C) Wilcoxon rank sum test.
D) Wilcoxon signed rank sum test.
A) Kruskal-Wallis test.
B) Friedman test.
C) Wilcoxon rank sum test.
D) Wilcoxon signed rank sum test.
فتح الحزمة
افتح القفل للوصول البطاقات البالغ عددها 126 في هذه المجموعة.
فتح الحزمة
k this deck
39
Which of the following best describes when the Wilcoxon rank sum test statistic T is approximately normally distributed?
A) For sample sizes larger than 30.
B) For sample sizes larger than 15.
C) For sample sizes larger than 20.
D) For sample sizes larger than 10.
A) For sample sizes larger than 30.
B) For sample sizes larger than 15.
C) For sample sizes larger than 20.
D) For sample sizes larger than 10.
فتح الحزمة
افتح القفل للوصول البطاقات البالغ عددها 126 في هذه المجموعة.
فتح الحزمة
k this deck
40
Which of the following best describes when a non-parametric test for comparing two or more populations should be used instead of its parametric counterpart?
A) When the sample sizes are large.
B) When the populations are normally distributed.
C) When the data are ordinal (ranked) or numerical and non-normal.
D) When the data are numerical.
A) When the sample sizes are large.
B) When the populations are normally distributed.
C) When the data are ordinal (ranked) or numerical and non-normal.
D) When the data are numerical.
فتح الحزمة
افتح القفل للوصول البطاقات البالغ عددها 126 في هذه المجموعة.
فتح الحزمة
k this deck
41
The Friedman test statistic is approximately chi-squared distributed with (k - 1) degrees of freedom, provided that either the number of blocks b or the number of treatments k is greater than or equal to 5.
فتح الحزمة
افتح القفل للوصول البطاقات البالغ عددها 126 في هذه المجموعة.
فتح الحزمة
k this deck
42
The z-test approximation to the Wilcoxon rank sum test for two independent samples requires that at least one of the two sample sizes exceed 10.
فتح الحزمة
افتح القفل للوصول البطاقات البالغ عددها 126 في هذه المجموعة.
فتح الحزمة
k this deck
43
The Wilcoxon signed rank sum test is applied to compare two populations when the samples are matched pairs and the data are interval but not normally distributed.
فتح الحزمة
افتح القفل للوصول البطاقات البالغ عددها 126 في هذه المجموعة.
فتح الحزمة
k this deck
44
A Wilcoxon rank sum test for comparing two independent samples involves two samples of sizes 5 and 8. The alternative hypothesis is that the location of population 1 is different from the location of population 2. Using the 0.10 significance level, the appropriate critical values are 21 and 49.
فتح الحزمة
افتح القفل للوصول البطاقات البالغ عددها 126 في هذه المجموعة.
فتح الحزمة
k this deck
45
The Wilcoxon signed rank sum test is the nonparametric counterpart of the t-test of µD.
فتح الحزمة
افتح القفل للوصول البطاقات البالغ عددها 126 في هذه المجموعة.
فتح الحزمة
k this deck
46
The Kruskal-Wallis test can be used to determine whether a difference exists between two populations. However, to determine whether one population location is larger than another, we must apply the Wilcoxon rank sum test.
فتح الحزمة
افتح القفل للوصول البطاقات البالغ عددها 126 في هذه المجموعة.
فتح الحزمة
k this deck
47
The sign test and the Wilcoxon signed rank sum test require matched pairs.
فتح الحزمة
افتح القفل للوصول البطاقات البالغ عددها 126 في هذه المجموعة.
فتح الحزمة
k this deck
48
A Wilcoxon rank sum test for comparing two independent samples involves two samples of sizes 6 and 9. The alternative hypothesis is that the location of population 1 is to the left of the location of population 2. Using the 0.05 significance level, the appropriate critical values are 31 and 65.
فتح الحزمة
افتح القفل للوصول البطاقات البالغ عددها 126 في هذه المجموعة.
فتح الحزمة
k this deck
49
The Kruskal-Wallis test requires independent sample.
فتح الحزمة
افتح القفل للوصول البطاقات البالغ عددها 126 في هذه المجموعة.
فتح الحزمة
k this deck
50
The Friedman test is the non-parametric counterpart of the randomised block experimental design of the analysis of variance.
فتح الحزمة
افتح القفل للوصول البطاقات البالغ عددها 126 في هذه المجموعة.
فتح الحزمة
k this deck
51
In a normal approximation to the sign test, the standardised test statistic is calculated as z = 2.07. If the alternative hypothesis states that the location of population 1 is to the right of the location of population 2, then the p-value of the test is 0.0192.
فتح الحزمة
افتح القفل للوصول البطاقات البالغ عددها 126 في هذه المجموعة.
فتح الحزمة
k this deck
52
The Kruskal-Wallis test uses the Chi-squared distribution.
فتح الحزمة
افتح القفل للوصول البطاقات البالغ عددها 126 في هذه المجموعة.
فتح الحزمة
k this deck
53
The critical value is taken from the t-distribution whenever the test is a Kruskal-Wallis test.
فتح الحزمة
افتح القفل للوصول البطاقات البالغ عددها 126 في هذه المجموعة.
فتح الحزمة
k this deck
54
A two-independent-sample t-test corresponds to a Wilcoxon signed rank sum test for paired samples.
فتح الحزمة
افتح القفل للوصول البطاقات البالغ عددها 126 في هذه المجموعة.
فتح الحزمة
k this deck
55
The Wilcoxon rank sum test for independent samples actually tests whether the population distributions are identical.
فتح الحزمة
افتح القفل للوصول البطاقات البالغ عددها 126 في هذه المجموعة.
فتح الحزمة
k this deck
56
A Wilcoxon rank sum test for comparing two populations involves two independent samples of sizes 15 and 20. The value of the unstandardised test statistic is T = 225. The value of the standardised test statistic is z = -1.50.
فتح الحزمة
افتح القفل للوصول البطاقات البالغ عددها 126 في هذه المجموعة.
فتح الحزمة
k this deck
57
A one-sample t-test is the parametric counterpart of the Friedman test for randomised block experimental design.
فتح الحزمة
افتح القفل للوصول البطاقات البالغ عددها 126 في هذه المجموعة.
فتح الحزمة
k this deck
58
In a Wilcoxon rank sum test for independent samples, the two sample sizes are 4 and 6, and the value of the Wilcoxon test statistic is T = 25. If the test is two-tailed and the level of significance is 0.05, then the null hypothesis will be rejected.
فتح الحزمة
افتح القفل للوصول البطاقات البالغ عددها 126 في هذه المجموعة.
فتح الحزمة
k this deck
59
In a normal approximation to the Wilcoxon rank sum test, the standardised test statistic is calculated as z = 1.96. For a two-tailed test, the p-value is 0.025.
فتح الحزمة
افتح القفل للوصول البطاقات البالغ عددها 126 في هذه المجموعة.
فتح الحزمة
k this deck
60
The Kruskal-Wallis test is applied to compare two or more populations when the samples are independent and the data are ordinal or numerical and non-normal.
فتح الحزمة
افتح القفل للوصول البطاقات البالغ عددها 126 في هذه المجموعة.
فتح الحزمة
k this deck
61
Radio advertising is big business, second only to television advertising. The objective for radio advertisements is to get listeners to remember as much as possible about the product/service being advertised. The advertising executive of a large company must decide between two pitched radio advertisements for their company. In order to ascertain the general public's perception, 12 randomly chosen people are selected to listen to both potential advertisements and are then asked a series of 5 questions regarding the radio advertisement's content. The number of correct responses are recorded and listed below. Assume that responses are non-normal. a. Which test is appropriate for this situation?
b. Do these data provide enough evidence at the 5% significance level to conclude that the two radio advertisements differ?
a. Which test is appropriate for this situation?b. Do these data provide enough evidence at the 5% significance level to conclude that the two radio advertisements differ?
فتح الحزمة
افتح القفل للوصول البطاقات البالغ عددها 126 في هذه المجموعة.
فتح الحزمة
k this deck
62
Use the 5% significance level to test the hypotheses. The two population locations are the same The two population locations are different,
given that the data below are drawn from a matched pair experiment.
The two population locations are the same The two population locations are different,given that the data below are drawn from a matched pair experiment.
فتح الحزمة
افتح القفل للوصول البطاقات البالغ عددها 126 في هذه المجموعة.
فتح الحزمة
k this deck
63
One of the required conditions of the sign test is that the number of nonzero differences n must be smaller than or equal to 10.
فتح الحزمة
افتح القفل للوصول البطاقات البالغ عددها 126 في هذه المجموعة.
فتح الحزمة
k this deck
64
The Wilcoxon rank sum test is used to compare two populations when the samples are independent and the data are either ordinal or interval but not normally distributed.
فتح الحزمة
افتح القفل للوصول البطاقات البالغ عددها 126 في هذه المجموعة.
فتح الحزمة
k this deck
65
We can use the Friedman test to determine whether two populations differ. The conclusion will be the same as that produced by the sign test.
فتح الحزمة
افتح القفل للوصول البطاقات البالغ عددها 126 في هذه المجموعة.
فتح الحزمة
k this deck
66
In testing the hypotheses: The two population locations are the same The two population locations are different,
with data drawn from two independent samples, the following statistics are calculated: , , , .
a. Which test is used for testing the hypotheses above?
b. What is the p-value of this test?
The two population locations are the same The two population locations are different,with data drawn from two independent samples, the following statistics are calculated:
, , , .a. Which test is used for testing the hypotheses above?
b. What is the p-value of this test?
فتح الحزمة
افتح القفل للوصول البطاقات البالغ عددها 126 في هذه المجموعة.
فتح الحزمة
k this deck
67
The following data were generated from a randomised blocked experiment. Conduct a Friedman test at the 5% significance level to determine if at least two population locations differ.
فتح الحزمة
افتح القفل للوصول البطاقات البالغ عددها 126 في هذه المجموعة.
فتح الحزمة
k this deck
68
Perform the Wilcoxon signed rank sum test for the following matched pairs to determine at the 10% significance level whether the two population locations differ.
فتح الحزمة
افتح القفل للوصول البطاقات البالغ عددها 126 في هذه المجموعة.
فتح الحزمة
k this deck
69
In testing the hypotheses
H0: The two population locations are the same
H1: The location of population A is to the left of the location of population B,
with data drawn from two independent samples, the following statistics are calculated: , , , .
a. Which test is used for testing the hypotheses above?
b. What is the p-value of this test?
H0: The two population locations are the same
H1: The location of population A is to the left of the location of population B,
with data drawn from two independent samples, the following statistics are calculated:
, , , .a. Which test is used for testing the hypotheses above?
b. What is the p-value of this test?
فتح الحزمة
افتح القفل للوصول البطاقات البالغ عددها 126 في هذه المجموعة.
فتح الحزمة
k this deck
70
Use the 5% significance level to test the hypotheses. The two population locations are the same The location of population A is to the left of the location of population B,
given that the data below are drawn from a matched pairs experiment.
given that the data below are drawn from a matched pairs experiment.
فتح الحزمة
افتح القفل للوصول البطاقات البالغ عددها 126 في هذه المجموعة.
فتح الحزمة
k this deck
71
Given the following statistics from a matched pairs experiment, perform the Wilcoxon signed rank sum test to determine whether we can infer at the 10% significance level that the two population locations differ. , n = 50
, n = 50 فتح الحزمة
افتح القفل للوصول البطاقات البالغ عددها 126 في هذه المجموعة.
فتح الحزمة
k this deck
72
The Friedman test is employed to compare two or more populations when the data are generated from a matched pairs experiment, and are either ordinal or interval but not normally distributed.
فتح الحزمة
افتح القفل للوصول البطاقات البالغ عددها 126 في هذه المجموعة.
فتح الحزمة
k this deck
73
We can use the Friedman test to determine whether a difference exists between two populations. However, if we want to determine whether one population location is larger than another, we must use the sign test.
فتح الحزمة
افتح القفل للوصول البطاقات البالغ عددها 126 في هذه المجموعة.
فتح الحزمة
k this deck
74
The following data represent the test scores of eight students on a statistics test before and after attending extra help sessions for the test. Uses the Wilcoxon signed rank sum test to determine at the 5% significance level whether the extra help sessions have been effective.
Uses the Wilcoxon signed rank sum test to determine at the 5% significance level whether the extra help sessions have been effective. فتح الحزمة
افتح القفل للوصول البطاقات البالغ عددها 126 في هذه المجموعة.
فتح الحزمة
k this deck
75
Given the following statistics, use the Wilcoxon rank sum test to determine at the 5% significance whether the location of population A is to the right of the location of population B. , , , .
, , , . فتح الحزمة
افتح القفل للوصول البطاقات البالغ عددها 126 في هذه المجموعة.
فتح الحزمة
k this deck
76
Use the Wilcoxon rank sum test on the data below to determine at the 5% significance level whether the location of population A is to the left of the location of population B.
فتح الحزمة
افتح القفل للوصول البطاقات البالغ عددها 126 في هذه المجموعة.
فتح الحزمة
k this deck
77
Each year the personnel department in a large corporation assesses the performance of all of its employees. Each employee is rated for various aspects of his or her job on a 7-point scale where
1 = very unsatisfactory and 7 = satisfactory. The president of the company believes that the assessment scores this year are lower than last year's. To examine the validity of this belief, she draws a random sample of six employees' scores from last year and another six employees' scores this year. Do the data listed below allow the president to conclude at the 5% significance level that her belief is correct?
1 = very unsatisfactory and 7 = satisfactory. The president of the company believes that the assessment scores this year are lower than last year's. To examine the validity of this belief, she draws a random sample of six employees' scores from last year and another six employees' scores this year. Do the data listed below allow the president to conclude at the 5% significance level that her belief is correct?
فتح الحزمة
افتح القفل للوصول البطاقات البالغ عددها 126 في هذه المجموعة.
فتح الحزمة
k this deck
78
A matched pairs experiment yielded the following results:
Number of positive differences = 18, number of negative differences = 7, number of zero differences = 3.
Can we infer at the 5% significance level that the location of population 1 is to the right of the location of population 2?
Number of positive differences = 18, number of negative differences = 7, number of zero differences = 3.
Can we infer at the 5% significance level that the location of population 1 is to the right of the location of population 2?
فتح الحزمة
افتح القفل للوصول البطاقات البالغ عددها 126 في هذه المجموعة.
فتح الحزمة
k this deck
79
The Kruskal-Wallis test can be used to test for a difference between two populations. It will produce the same outcome as the two-tailed Wilcoxon rank sum test.
فتح الحزمة
افتح القفل للوصول البطاقات البالغ عددها 126 في هذه المجموعة.
فتح الحزمة
k this deck
80
The sign test is employed to compare two populations when the experimental design is matched pairs, and the data are ordinal but not normally distributed.
فتح الحزمة
افتح القفل للوصول البطاقات البالغ عددها 126 في هذه المجموعة.
فتح الحزمة
k this deck
فتح الحزمة
افتح القفل للوصول البطاقات البالغ عددها 126 في هذه المجموعة.


