Deck 16: Regression
ملء الشاشة (f)
سؤال
سؤال
سؤال
سؤال
سؤال
سؤال
سؤال
سؤال
سؤال
سؤال
سؤال
سؤال
سؤال
سؤال
سؤال
سؤال
سؤال
سؤال
سؤال
سؤال
سؤال
سؤال
سؤال
سؤال
سؤال
سؤال
Use the following to answer questions
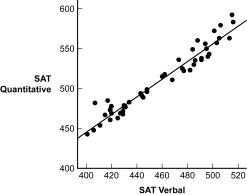
The scatterplot and regression line on the left depict the relation between a state's expenditure per student and the average SAT scores for students in the state.The scatterplot and regression line on the right depict the relation between students' SAT Verbal and SAT Quantitative scores.
Figure: Standard Error Comparisons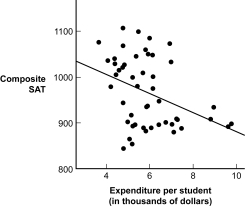
(Figure: Standard Error Comparisons) For which prediction is the standard error of the estimate greater?
A) state expenditure per student from composite SAT scores
B) composite SAT scores from the state's expenditure per student
C) SAT Quantitative scores from SAT Verbal scores
D) SAT Verbal scores from SAT Quantitative scores
سؤال
سؤال
سؤال
سؤال
سؤال
سؤال
سؤال
سؤال
سؤال
Use the following to answer questions
The scatterplot and regression line on the left depict the relation between a state's expenditure per student and the average SAT scores for students in the state.The scatterplot and regression line on the right depict the relation between students' SAT Verbal and SAT Quantitative scores.
Figure: Standard Error Comparisons
(Figure: Standard Error Comparisons) Based on the scatterplots, for which prediction is the r2 greater?
A) state expenditure per student from composite SAT scores
B) composite SAT scores from the state's expenditure per student
C) SAT Quantitative scores from SAT Verbal scores
D) SAT Verbal scores from SAT Quantitative scores
سؤال
سؤال
سؤال
سؤال
سؤال
سؤال
سؤال
سؤال
سؤال
سؤال
سؤال
سؤال
سؤال
سؤال
سؤال
سؤال
سؤال
سؤال
سؤال
سؤال
سؤال
سؤال
سؤال
سؤال
سؤال
سؤال
سؤال
سؤال
سؤال
سؤال
سؤال
سؤال
سؤال
سؤال
سؤال
سؤال
سؤال
سؤال
سؤال
سؤال
سؤال
سؤال
سؤال
سؤال
سؤال

فتح الحزمة
قم بالتسجيل لفتح البطاقات في هذه المجموعة!
Unlock Deck
Unlock Deck
1/113
العب
ملء الشاشة (f)
Deck 16: Regression
1
The correlation between the number of ounces of candy a child consumes weekly and the number of cavities the child has at the age of 13 is 0.78.If a child has a z score of -0.85 on the candy-consumed variable, the z score on the variable number of cavities would be predicted to be:
A) -0.66.
B) -0.92.
C) 0.66.
D) 0.92.
A) -0.66.
B) -0.92.
C) 0.66.
D) 0.92.
-0.66.
2
What is the formula for predicting an individual's z score on the dependent variable from the z score on the independent variable using the correlation coefficient?
A)
B)
C)
D)
A)
B)
C)
D)
3
In a 2008 article by Hsiu-Ling Lee, data from 147 colleges from 1995 to 2005 were used to predict endowments to a college from the average SAT score of students attending the college, among other variables.The resulting regression equation for just these variables was Ŷ = -20.46 + 4.06(X).Using the regression equation, what would be predicted to be the endowments (in billions) to a college whose students' average SAT score is 1020?
A) 3.6 billion
B) 4,120.74 billion
C) 4,161.66 billion
D) 20,865.14 billion
A) 3.6 billion
B) 4,120.74 billion
C) 4,161.66 billion
D) 20,865.14 billion
4,120.74 billion
4
In the equation for a regression line, the slope is the:
A) value for X when Y is equal to 0.
B) predicted value for Y when X is equal to 0.
C) amount that Y is predicted to increase for a one-unit increase in X.
D) z score of the amount that Y is predicted to increase as X increases.
A) value for X when Y is equal to 0.
B) predicted value for Y when X is equal to 0.
C) amount that Y is predicted to increase for a one-unit increase in X.
D) z score of the amount that Y is predicted to increase as X increases.
فتح الحزمة
افتح القفل للوصول البطاقات البالغ عددها 113 في هذه المجموعة.
فتح الحزمة
k this deck
5
If the correlation between the number of beers consumed over a semester and the GPA for the semester is -0.56, what would be the predicted z score for a person who has a z score of -0.95 for the number of beers consumed?
A) 0.59
B) -0.59
C) 0.53
D) -0.53
A) 0.59
B) -0.59
C) 0.53
D) -0.53
فتح الحزمة
افتح القفل للوصول البطاقات البالغ عددها 113 في هذه المجموعة.
فتح الحزمة
k this deck
6
Regression is to _____ as correlation is to _____.
A) association; causation
B) causation; association
C) relation; prediction
D) prediction; relation
A) association; causation
B) causation; association
C) relation; prediction
D) prediction; relation
فتح الحزمة
افتح القفل للوصول البطاقات البالغ عددها 113 في هذه المجموعة.
فتح الحزمة
k this deck
7
The predicted z score for the dependent variable will always be _____ the individual's z score for the independent variable.
A) more than
B) the same as
C) two times
D) less than
A) more than
B) the same as
C) two times
D) less than
فتح الحزمة
افتح القفل للوصول البطاقات البالغ عددها 113 في هذه المجموعة.
فتح الحزمة
k this deck
8
Y is the symbol for a(n) _____, and Ŷ is the symbol for a(n) _____.
A) predicted score on the independent variable; observed score on the independent variable
B) observed score on the dependent variable; predicted score on the dependent variable
C) observed score on the independent variable; predicted score on the dependent variable
D) predicted score on the dependent variable; observed score on the independent variable
فتح الحزمة
افتح القفل للوصول البطاقات البالغ عددها 113 في هذه المجموعة.
فتح الحزمة
k this deck
9
Data from the World Health Organization in 2013 were used to predict the life expectancy for men in a country from the life expectancy of women in the country.The resulting regression equation was Ŷ = 3.73 + 0.88(X).Using the regression equation, what would be the predicted life expectancy of men in a country in which the life expectancy for women is 70 years?
A) 57.87 years
B) 60.93 years
C) 65.33 years
D) 69.61 years
A) 57.87 years
B) 60.93 years
C) 65.33 years
D) 69.61 years
فتح الحزمة
افتح القفل للوصول البطاقات البالغ عددها 113 في هذه المجموعة.
فتح الحزمة
k this deck
10
Simple linear regression allows one to:
A) determine the relation among four or more variables.
B) predict an individual's score on a dependent variable from her score on multiple independent variables.
C) predict an individual's score on the dependent variable from her score on the independent variable.
D) infer the direction of causal relations.
فتح الحزمة
افتح القفل للوصول البطاقات البالغ عددها 113 في هذه المجموعة.
فتح الحزمة
k this deck
11
Data from 147 colleges from 1995 to 2005 (Lee, 2008) were used to predict the endowments (in billions) to a college from the average SAT score of students attending the college.The resulting regression equation was Ŷ = -20.46 + 4.06(X).This regression indicates that:
A) most colleges have very high endowments.
B) for every one-point increase in SAT scores, a college can expect 4.06 billion more in endowments.
C) for every one-dollar increase in endowments, the college can expect a half-point increase in SAT scores.
D) for every one-point increase in SAT scores, a college can expect 20.46 billion fewer in endowments.
فتح الحزمة
افتح القفل للوصول البطاقات البالغ عددها 113 في هذه المجموعة.
فتح الحزمة
k this deck
12
The tendency of scores that are particularly high or low to drift toward the mean over time is called:
A) simple linear regression.
B) standard error of the mean.
C) regression to the mean.
D) standard error of the estimate.
A) simple linear regression.
B) standard error of the mean.
C) regression to the mean.
D) standard error of the estimate.
فتح الحزمة
افتح القفل للوصول البطاقات البالغ عددها 113 في هذه المجموعة.
فتح الحزمة
k this deck
13
In the formula Ŷ = a + b(X), b is the:
A) slope.
B) intercept.
C) predicted value for the dependent variable.
D) observed value on the independent variable.
A) slope.
B) intercept.
C) predicted value for the dependent variable.
D) observed value on the independent variable.
فتح الحزمة
افتح القفل للوصول البطاقات البالغ عددها 113 في هذه المجموعة.
فتح الحزمة
k this deck
14
Which statement about the slope of the simple linear regression line is true?
A) It has the same sign as the correlation.
B) It is expressed as a standardized value.
C) The square of the slope is the proportion of variation in Y explained by X.
D) It is the value of Y when X is zero.
A) It has the same sign as the correlation.
B) It is expressed as a standardized value.
C) The square of the slope is the proportion of variation in Y explained by X.
D) It is the value of Y when X is zero.
فتح الحزمة
افتح القفل للوصول البطاقات البالغ عددها 113 في هذه المجموعة.
فتح الحزمة
k this deck
15
In the formula Ŷ = a + b(X), a is the:
A) slope.
B) intercept.
C) predicted value for the dependent variable.
D) observed value on the independent variable.
A) slope.
B) intercept.
C) predicted value for the dependent variable.
D) observed value on the independent variable.
فتح الحزمة
افتح القفل للوصول البطاقات البالغ عددها 113 في هذه المجموعة.
فتح الحزمة
k this deck
16
In the equation for a regression line, the intercept is the:
A) value for X when Y is equal to 0.
B) predicted value for Y when X is equal to 0.
C) amount that Y is predicted to increase for a one-unit increase in X.
D) z score of the amount that Y is predicted to increase as X increases.
A) value for X when Y is equal to 0.
B) predicted value for Y when X is equal to 0.
C) amount that Y is predicted to increase for a one-unit increase in X.
D) z score of the amount that Y is predicted to increase as X increases.
فتح الحزمة
افتح القفل للوصول البطاقات البالغ عددها 113 في هذه المجموعة.
فتح الحزمة
k this deck
17
Which sentence does NOT state a limitation of using regression?
A) The presence of confounding variables may limit confidence in the findings.
B) The data used are rarely from a true experiment.
C) Regression is only appropriate with linear data.
D) Regression allows one to determine an equation for a straight line.
A) The presence of confounding variables may limit confidence in the findings.
B) The data used are rarely from a true experiment.
C) Regression is only appropriate with linear data.
D) Regression allows one to determine an equation for a straight line.
فتح الحزمة
افتح القفل للوصول البطاقات البالغ عددها 113 في هذه المجموعة.
فتح الحزمة
k this deck
18
Regression cannot prove causation, but it can:
A) provide specific quantitative predictions that help explain relations among variables.
B) provide stronger evidence for association than does correlation.
C) predict people's behaviors on variables that may seem impossible to measure.
D) serve as a substitute for good experimental design.
A) provide specific quantitative predictions that help explain relations among variables.
B) provide stronger evidence for association than does correlation.
C) predict people's behaviors on variables that may seem impossible to measure.
D) serve as a substitute for good experimental design.
فتح الحزمة
افتح القفل للوصول البطاقات البالغ عددها 113 في هذه المجموعة.
فتح الحزمة
k this deck
19
Which statistical tool allows one to predict a dependent score based on information about an independent variable?
A) t test
B) correlation
C) regression
D) standardization
A) t test
B) correlation
C) regression
D) standardization
فتح الحزمة
افتح القفل للوصول البطاقات البالغ عددها 113 في هذه المجموعة.
فتح الحزمة
k this deck
20
Data from the World Health Organization in 2013 were used to predict the life expectancy for men in a country from the life expectancy of women in the country.The resulting regression equation was Ŷ = 3.73 + 0.88(X).This regression equation implies that:
A) when a woman's life expectancy increases by 1 year, a man's life expectancy increases by 3.73 years.
B) women live 0.88 times as long as men do.
C) when a woman's life expectancy increases by 1 year, a man's life expectancy increases by 0.88 of a year.
D) the average life expectancy for men in some countries is 3.73.
فتح الحزمة
افتح القفل للوصول البطاقات البالغ عددها 113 في هذه المجموعة.
فتح الحزمة
k this deck
21
A high standard error of the estimate indicates that the:
A) mean is not a good representation of the sample data.
B) observed Ys will vary greatly from the predicted Ys.
C) sample mean is not a good representation of the population mean.
D) observed Ys will cluster closely around the regression line.
A) mean is not a good representation of the sample data.
B) observed Ys will vary greatly from the predicted Ys.
C) sample mean is not a good representation of the population mean.
D) observed Ys will cluster closely around the regression line.
فتح الحزمة
افتح القفل للوصول البطاقات البالغ عددها 113 في هذه المجموعة.
فتح الحزمة
k this deck
22
If the standard error of the estimate is zero, the relation between two variables is:
A) curvilinear.
B) imperfect.
C) perfect.
D) unknown.
A) curvilinear.
B) imperfect.
C) perfect.
D) unknown.
فتح الحزمة
افتح القفل للوصول البطاقات البالغ عددها 113 في هذه المجموعة.
فتح الحزمة
k this deck
23
The standardized regression coefficient expresses the:
A) relation between the independent and dependent variable in terms of squared units.
B) strength of the correlation between the two variables that are now incorporated into a regression analysis.
C) predicted change in the dependent variable in terms of standard deviations for an increase of 1 standard deviation in the independent variable.
D) likelihood of rejecting the null hypothesis with a regression analysis.
فتح الحزمة
افتح القفل للوصول البطاقات البالغ عددها 113 في هذه المجموعة.
فتح الحزمة
k this deck
24
The standard error of estimate could be thought of as the:
A) standard deviation of the data points around the regression line.
B) standard deviation of the independent variable on the regression line.
C) standard deviation of the dependent variable.
D) amount of error made in random selection.
A) standard deviation of the data points around the regression line.
B) standard deviation of the independent variable on the regression line.
C) standard deviation of the dependent variable.
D) amount of error made in random selection.
فتح الحزمة
افتح القفل للوصول البطاقات البالغ عددها 113 في هذه المجموعة.
فتح الحزمة
k this deck
25
A simple way to calculate proportionate reduction in error is by:
A) taking the square root of the correlation coefficient.
B) squaring SStotal.
C) squaring the correlation coefficient.
D) adding the slope and y intercept.
A) taking the square root of the correlation coefficient.
B) squaring SStotal.
C) squaring the correlation coefficient.
D) adding the slope and y intercept.
فتح الحزمة
افتح القفل للوصول البطاقات البالغ عددها 113 في هذه المجموعة.
فتح الحزمة
k this deck
26
Use the following to answer questions
The scatterplot and regression line on the left depict the relation between a state's expenditure per student and the average SAT scores for students in the state.The scatterplot and regression line on the right depict the relation between students' SAT Verbal and SAT Quantitative scores.
Figure: Standard Error Comparisons
(Figure: Standard Error Comparisons) For which prediction is the standard error of the estimate greater?
A) state expenditure per student from composite SAT scores
B) composite SAT scores from the state's expenditure per student
C) SAT Quantitative scores from SAT Verbal scores
D) SAT Verbal scores from SAT Quantitative scores
فتح الحزمة
افتح القفل للوصول البطاقات البالغ عددها 113 في هذه المجموعة.
فتح الحزمة
k this deck
27
Which statistic quantifies the improvement in ability to predict a person's score when using the regression line rather than the mean?
A) standard error of the estimation
B) standard deviation
C) slope
D) proportionate reduction in error
A) standard error of the estimation
B) standard deviation
C) slope
D) proportionate reduction in error
فتح الحزمة
افتح القفل للوصول البطاقات البالغ عددها 113 في هذه المجموعة.
فتح الحزمة
k this deck
28
Every year it seems as though last season's baseball rookie of the year fails to live up to expectations for his sophomore season.What might explain this phenomenon?
A) regression to the mean
B) overestimation of effect size
C) standard error of the estimation
D) proportionate reduction in error
A) regression to the mean
B) overestimation of effect size
C) standard error of the estimation
D) proportionate reduction in error
فتح الحزمة
افتح القفل للوصول البطاقات البالغ عددها 113 في هذه المجموعة.
فتح الحزمة
k this deck
29
The proportionate reduction in error is a measure of the:
A) amount of variance in the dependent variable explained by the independent variable.
B) correlation between two variables.
C) amount of variance in the independent variable explained by the dependent variable.
D) slope of a regression line.
A) amount of variance in the dependent variable explained by the independent variable.
B) correlation between two variables.
C) amount of variance in the independent variable explained by the dependent variable.
D) slope of a regression line.
فتح الحزمة
افتح القفل للوصول البطاقات البالغ عددها 113 في هذه المجموعة.
فتح الحزمة
k this deck
30
The standardized regression coefficient expresses a predicted change in the dependent variable in terms of:
A) standard deviation units.
B) slope.
C) a one-unit change in the independent variable.
D) error units.
A) standard deviation units.
B) slope.
C) a one-unit change in the independent variable.
D) error units.
فتح الحزمة
افتح القفل للوصول البطاقات البالغ عددها 113 في هذه المجموعة.
فتح الحزمة
k this deck
31
For a simple linear regression, the standardized regression coefficient is:
A) the square of the r statistic.
B) equal to the Pearson correlation coefficient.
C) the square root of the slope.
D) unrelated to the correlation value.
A) the square of the r statistic.
B) equal to the Pearson correlation coefficient.
C) the square root of the slope.
D) unrelated to the correlation value.
فتح الحزمة
افتح القفل للوصول البطاقات البالغ عددها 113 في هذه المجموعة.
فتح الحزمة
k this deck
32
Proportionate reduction in error can be symbolized by:
A) r2.
B) d.
C) r.
D) b.
A) r2.
B) d.
C) r.
D) b.
فتح الحزمة
افتح القفل للوصول البطاقات البالغ عددها 113 في هذه المجموعة.
فتح الحزمة
k this deck
33
Which is the correct formula for the proportionate reduction in error?
A) (b)
B)
C) a + bX
D)
SNtral
A) (b)
B)
C) a + bX
D)
SNtral
فتح الحزمة
افتح القفل للوصول البطاقات البالغ عددها 113 في هذه المجموعة.
فتح الحزمة
k this deck
34
A man and woman who are both tall (he is 6 feet tall and she is 5 feet, 10 inches) have four children; which child represents regression to the mean for height?
A) Janet who is 5 feet tall
B) Amy who is 5 feet, 1 inch tall
C) Laura who is 5 feet, 5 inches tall
D) John who is 6 feet, 2 inches tall
A) Janet who is 5 feet tall
B) Amy who is 5 feet, 1 inch tall
C) Laura who is 5 feet, 5 inches tall
D) John who is 6 feet, 2 inches tall
فتح الحزمة
افتح القفل للوصول البطاقات البالغ عددها 113 في هذه المجموعة.
فتح الحزمة
k this deck
35
Use the following to answer questions
The scatterplot and regression line on the left depict the relation between a state's expenditure per student and the average SAT scores for students in the state.The scatterplot and regression line on the right depict the relation between students' SAT Verbal and SAT Quantitative scores.
Figure: Standard Error Comparisons
(Figure: Standard Error Comparisons) Based on the scatterplots, for which prediction is the r2 greater?
A) state expenditure per student from composite SAT scores
B) composite SAT scores from the state's expenditure per student
C) SAT Quantitative scores from SAT Verbal scores
D) SAT Verbal scores from SAT Quantitative scores
فتح الحزمة
افتح القفل للوصول البطاقات البالغ عددها 113 في هذه المجموعة.
فتح الحزمة
k this deck
36
As r2 increases, the standard error of the estimate:
A) increases.
B) decreases.
C) stays the same.
D) gets closer to 1.
A) increases.
B) decreases.
C) stays the same.
D) gets closer to 1.
فتح الحزمة
افتح القفل للوصول البطاقات البالغ عددها 113 في هذه المجموعة.
فتح الحزمة
k this deck
37
As the standard error of estimate becomes larger, predictions become:
A) less accurate.
B) more accurate.
C) larger.
D) smaller.
A) less accurate.
B) more accurate.
C) larger.
D) smaller.
فتح الحزمة
افتح القفل للوصول البطاقات البالغ عددها 113 في هذه المجموعة.
فتح الحزمة
k this deck
38
The standard error of the estimate indicates:
A) how far two regression lines are from each other.
B) how far, on average, the regression line is from the mean.
C) how much error there is in any single prediction made from a given regression equation.
D) the typical distance between the regression line and each of the observed data points.
A) how far two regression lines are from each other.
B) how far, on average, the regression line is from the mean.
C) how much error there is in any single prediction made from a given regression equation.
D) the typical distance between the regression line and each of the observed data points.
فتح الحزمة
افتح القفل للوصول البطاقات البالغ عددها 113 في هذه المجموعة.
فتح الحزمة
k this deck
39
The regression line is the line that:
A) minimizes error in predicting scores on the dependent variable.
B) is the mean of the dependent variable.
C) minimizes error in predicting scores on the independent variable.
D) minimizes the correlation coefficient.
A) minimizes error in predicting scores on the dependent variable.
B) is the mean of the dependent variable.
C) minimizes error in predicting scores on the independent variable.
D) minimizes the correlation coefficient.
فتح الحزمة
افتح القفل للوصول البطاقات البالغ عددها 113 في هذه المجموعة.
فتح الحزمة
k this deck
40
Under what circumstance, unlikely as it might be, would the standard error of estimate be zero?
A) The proportionate reduction in error is zero.
B) The correlation coefficient is zero.
C) The correlation coefficient is either 1.00 or -1.00.
D) The proportionate reduction in error is 1.
A) The proportionate reduction in error is zero.
B) The correlation coefficient is zero.
C) The correlation coefficient is either 1.00 or -1.00.
D) The proportionate reduction in error is 1.
فتح الحزمة
افتح القفل للوصول البطاقات البالغ عددها 113 في هذه المجموعة.
فتح الحزمة
k this deck
41
For the equation Ŷ = 130 + 5(X1) + 3(X2), which statement is true?
A) 130 is the slope of the line.
B) This is a simple linear regression equation.
C) There are two slopes.
D) The y intercept is 8.
A) 130 is the slope of the line.
B) This is a simple linear regression equation.
C) There are two slopes.
D) The y intercept is 8.
فتح الحزمة
افتح القفل للوصول البطاقات البالغ عددها 113 في هذه المجموعة.
فتح الحزمة
k this deck
42
The arrows in a structural equation model indicate the:
A) causal direction of a relation.
B) strength and direction of a predictive relation.
C) number of variables that determine the prediction equation.
D) latent variables.
A) causal direction of a relation.
B) strength and direction of a predictive relation.
C) number of variables that determine the prediction equation.
D) latent variables.
فتح الحزمة
افتح القفل للوصول البطاقات البالغ عددها 113 في هذه المجموعة.
فتح الحزمة
k this deck
43
Structural equation modeling involves:
A) quantifying how well data fit a specified theory.
B) using a single independent variable to predict multiple dependent variables.
C) using multiple independent variables to predict a single dependent variable.
D) determining the amount of error present in a regression.
A) quantifying how well data fit a specified theory.
B) using a single independent variable to predict multiple dependent variables.
C) using multiple independent variables to predict a single dependent variable.
D) determining the amount of error present in a regression.
فتح الحزمة
افتح القفل للوصول البطاقات البالغ عددها 113 في هذه المجموعة.
فتح الحزمة
k this deck
44
What information do the slopes in a multiple regression equation provide about the correlation coefficient?
A) The slopes tell us nothing about the correlation coefficient.
B) The sign of the slope (positive or negative) tells us the direction of the correlation.
C) The slope sign is inversely related to the direction of the correlation.
D) The magnitude of the slope tells us how strong the correlation coefficient is.
فتح الحزمة
افتح القفل للوصول البطاقات البالغ عددها 113 في هذه المجموعة.
فتح الحزمة
k this deck
45
As the correlation coefficient becomes stronger, proportionate reduction in error:
A) becomes smaller.
B) becomes larger.
C) is unaffected.
D) becomes more variable.
A) becomes smaller.
B) becomes larger.
C) is unaffected.
D) becomes more variable.
فتح الحزمة
افتح القفل للوصول البطاقات البالغ عددها 113 في هذه المجموعة.
فتح الحزمة
k this deck
46
To predict a single dependent variable from more than one independent variable, which statistical technique should be used?
A) multiple regression
B) structural equation modeling
C) simple linear regression
D) correlation
A) multiple regression
B) structural equation modeling
C) simple linear regression
D) correlation
فتح الحزمة
افتح القفل للوصول البطاقات البالغ عددها 113 في هذه المجموعة.
فتح الحزمة
k this deck
47
In the equation Ŷ = 98 + 4.30(X1) + 7.20(X2), what is/are the slope(s)?
A) 98
B) 98 and 4.30
C) 4.30
D) 4.30 and 7.20
A) 98
B) 98 and 4.30
C) 4.30
D) 4.30 and 7.20
فتح الحزمة
افتح القفل للوصول البطاقات البالغ عددها 113 في هذه المجموعة.
فتح الحزمة
k this deck
48
Carrico, Gifford, and Moos (2007) studied the relation between a substance abuser's spirituality/religiosity and her participation in a 12-step program.Participants in the study rated their agreement, on a scale from 1 to 5, with statements such as, "In my life I experience the presence of the divine." In this study, spirituality/religiosity is the _____ and participants' ratings of agreement to the specific statements are the _____.
A) dependent variable; independent variables
B) independent variable; dependent variables
C) manifest variable; latent variables
D) latent variable; manifest variables
A) dependent variable; independent variables
B) independent variable; dependent variables
C) manifest variable; latent variables
D) latent variable; manifest variables
فتح الحزمة
افتح القفل للوصول البطاقات البالغ عددها 113 في هذه المجموعة.
فتح الحزمة
k this deck
49
The predicted z score on the dependent variable will always be closer to its mean than the z score for the independent variable.
فتح الحزمة
افتح القفل للوصول البطاقات البالغ عددها 113 في هذه المجموعة.
فتح الحزمة
k this deck
50
An independent variable that makes a unique contribution to the prediction of a dependent variable is a(n) _____ variable.
A) orthogonal
B) latent
C) manifest
D) unique
A) orthogonal
B) latent
C) manifest
D) unique
فتح الحزمة
افتح القفل للوصول البطاقات البالغ عددها 113 في هذه المجموعة.
فتح الحزمة
k this deck
51
A manifest variable is:
A) an idea or construct we cannot directly observe, but still wish to measure.
B) a variable that can be directly observed and is measured in a research study.
C) the dependent variable when performing structural equation modeling.
D) the dependent variable when performing multiple regression.
A) an idea or construct we cannot directly observe, but still wish to measure.
B) a variable that can be directly observed and is measured in a research study.
C) the dependent variable when performing structural equation modeling.
D) the dependent variable when performing multiple regression.
فتح الحزمة
افتح القفل للوصول البطاقات البالغ عددها 113 في هذه المجموعة.
فتح الحزمة
k this deck
52
In a study designed to predict blood cholesterol levels from amount of daily saturated fat in grams (X1) and number of hours of daily exercise (X2), the slope of X1 is 5, the slope of X2 is -4, and the y intercept is 130.Which formula is the regression equation for these data?
A) Ŷ = 130 + 5(X1) - 4(X2)
B) Ŷ = 130 - 4(X1) - 5(X2)
C) Ŷ = 130 + 5(X1) + 4(X2)
D) Ŷ = 130 + 1(X)
A) Ŷ = 130 + 5(X1) - 4(X2)
B) Ŷ = 130 - 4(X1) - 5(X2)
C) Ŷ = 130 + 5(X1) + 4(X2)
D) Ŷ = 130 + 1(X)
فتح الحزمة
افتح القفل للوصول البطاقات البالغ عددها 113 في هذه المجموعة.
فتح الحزمة
k this deck
53
If two variables, independently, can help predict the outcome of a third variable, they are:
A) autonomous.
B) orthogonal.
C) standardized.
D) proportionate.
A) autonomous.
B) orthogonal.
C) standardized.
D) proportionate.
فتح الحزمة
افتح القفل للوصول البطاقات البالغ عددها 113 في هذه المجموعة.
فتح الحزمة
k this deck
54
A researcher wants to be able to predict first-semester grade point average with as much accuracy as possible, so she would like to use both high school grade point average and SAT score as predictor variables.Which technique would be most appropriate to make this prediction?
A) simple linear regression
B) proportionate reduction in error
C) multiple regression
D) standardized regression coefficient
A) simple linear regression
B) proportionate reduction in error
C) multiple regression
D) standardized regression coefficient
فتح الحزمة
افتح القفل للوصول البطاقات البالغ عددها 113 في هذه المجموعة.
فتح الحزمة
k this deck
55
Regression capitalizes on correlation by using what is known about the relation between two variables to make predictions beyond those variables.
فتح الحزمة
افتح القفل للوصول البطاقات البالغ عددها 113 في هذه المجموعة.
فتح الحزمة
k this deck
56
In the equation Ŷ = 130 + 5(X1) + 3(X2), what is the y intercept?
A) 130
B) 8
C) 5
D) 3
A) 130
B) 8
C) 5
D) 3
فتح الحزمة
افتح القفل للوصول البطاقات البالغ عددها 113 في هذه المجموعة.
فتح الحزمة
k this deck
57
Correlation involves relating variables, whereas regression involves prediction.
فتح الحزمة
افتح القفل للوصول البطاقات البالغ عددها 113 في هذه المجموعة.
فتح الحزمة
k this deck
58
A latent variable is:
A) an idea or construct we cannot directly observe, but still wish to measure.
B) a variable that can be directly observed and is measured in a research study.
C) the dependent variable when performing structural equation modeling.
D) the dependent variable when performing multiple regression.
A) an idea or construct we cannot directly observe, but still wish to measure.
B) a variable that can be directly observed and is measured in a research study.
C) the dependent variable when performing structural equation modeling.
D) the dependent variable when performing multiple regression.
فتح الحزمة
افتح القفل للوصول البطاقات البالغ عددها 113 في هذه المجموعة.
فتح الحزمة
k this deck
59
In the computer printouts presented in the text, information for the multiple regression equation can be found in the column labeled:
A) standardized coefficients.
B) B under unstandardized coefficients.
C) beta under standardized coefficients.
D) sig.
A) standardized coefficients.
B) B under unstandardized coefficients.
C) beta under standardized coefficients.
D) sig.
فتح الحزمة
افتح القفل للوصول البطاقات البالغ عددها 113 في هذه المجموعة.
فتح الحزمة
k this deck
60
If someone reports that she typically eats 15 grams of saturated fat daily and exercises 1 hour daily, what would her cholesterol level be predicted to be?
A) 75
B) 145
C) 180
D) 201
A) 75
B) 145
C) 180
D) 201
فتح الحزمة
افتح القفل للوصول البطاقات البالغ عددها 113 في هذه المجموعة.
فتح الحزمة
k this deck
61
It is inappropriate to use structural equation modeling if there is not an a priori theoretical idea regarding the pattern of relations among the variables being measured.
فتح الحزمة
افتح القفل للوصول البطاقات البالغ عددها 113 في هذه المجموعة.
فتح الحزمة
k this deck
62
The intercept is the predicted value for X when Y is equal to 0.
فتح الحزمة
افتح القفل للوصول البطاقات البالغ عددها 113 في هذه المجموعة.
فتح الحزمة
k this deck
63
The intercept is the predicted value for Y when X is equal to 0.
فتح الحزمة
افتح القفل للوصول البطاقات البالغ عددها 113 في هذه المجموعة.
فتح الحزمة
k this deck
64
The simple linear regression equation uses the following formula: Ŷ = a + b(X).
فتح الحزمة
افتح القفل للوصول البطاقات البالغ عددها 113 في هذه المجموعة.
فتح الحزمة
k this deck
65
The slope is the amount that X is predicted to increase for an increase of 1 in Y.
فتح الحزمة
افتح القفل للوصول البطاقات البالغ عددها 113 في هذه المجموعة.
فتح الحزمة
k this deck
66
The simple linear regression equation uses the following formula: Ŷ = a(X) + b.
فتح الحزمة
افتح القفل للوصول البطاقات البالغ عددها 113 في هذه المجموعة.
فتح الحزمة
k this deck
67
The predicted z score on the dependent variable will always be closer to the z score for the independent variable than its mean.
فتح الحزمة
افتح القفل للوصول البطاقات البالغ عددها 113 في هذه المجموعة.
فتح الحزمة
k this deck
68
It is impossible for the regression line to do a poorer job than the mean of predicting the dependent variable.
فتح الحزمة
افتح القفل للوصول البطاقات البالغ عددها 113 في هذه المجموعة.
فتح الحزمة
k this deck
69
The slope is the predicted value for Y when X is equal to 0.
فتح الحزمة
افتح القفل للوصول البطاقات البالغ عددها 113 في هذه المجموعة.
فتح الحزمة
k this deck
70
The slope is the amount that Y is predicted to increase for an increase of 1 in X.
فتح الحزمة
افتح القفل للوصول البطاقات البالغ عددها 113 في هذه المجموعة.
فتح الحزمة
k this deck
71
The standard error of estimate is a measure of how accurately we predict using the regression equation or line of best fit.
فتح الحزمة
افتح القفل للوصول البطاقات البالغ عددها 113 في هذه المجموعة.
فتح الحزمة
k this deck
72
Correlation coefficient and proportionate reduction in error are inversely related; that is, as the correlation coefficient increases, proportion reduction in error decreases.
فتح الحزمة
افتح القفل للوصول البطاقات البالغ عددها 113 في هذه المجموعة.
فتح الحزمة
k this deck
73
Simple linear regression is a statistical technique that includes two or more predictor variables in a prediction equation.
فتح الحزمة
افتح القفل للوصول البطاقات البالغ عددها 113 في هذه المجموعة.
فتح الحزمة
k this deck
74
Latent variables are what we can observe and measure.
فتح الحزمة
افتح القفل للوصول البطاقات البالغ عددها 113 في هذه المجموعة.
فتح الحزمة
k this deck
75
Regression is typically used when analyzing the results of an experiment.
فتح الحزمة
افتح القفل للوصول البطاقات البالغ عددها 113 في هذه المجموعة.
فتح الحزمة
k this deck
76
The intercept is the predicted value for Y when X is equal to 1.
فتح الحزمة
افتح القفل للوصول البطاقات البالغ عددها 113 في هذه المجموعة.
فتح الحزمة
k this deck
77
Latent variables are what we want to research but cannot directly measure.
فتح الحزمة
افتح القفل للوصول البطاقات البالغ عددها 113 في هذه المجموعة.
فتح الحزمة
k this deck
78
Unlike correlation, regression can prove causal direction of a relation between two variables.
فتح الحزمة
افتح القفل للوصول البطاقات البالغ عددها 113 في هذه المجموعة.
فتح الحزمة
k this deck
79
The intercept is the amount that Y is predicted to increase for an increase of 1 in X.
فتح الحزمة
افتح القفل للوصول البطاقات البالغ عددها 113 في هذه المجموعة.
فتح الحزمة
k this deck
80
Like correlation, regression cannot prove causal direction of a relation between two variables.
فتح الحزمة
افتح القفل للوصول البطاقات البالغ عددها 113 في هذه المجموعة.
فتح الحزمة
k this deck
فتح الحزمة
افتح القفل للوصول البطاقات البالغ عددها 113 في هذه المجموعة.


