Deck 4: Techniques for Understanding Consumer Demand and Behavior
ملء الشاشة (f)
سؤال
سؤال
سؤال
سؤال
سؤال
سؤال
سؤال
سؤال
سؤال
سؤال
سؤال
سؤال
سؤال
سؤال
سؤال
سؤال
سؤال
سؤال
سؤال
سؤال
سؤال
سؤال
سؤال
سؤال
سؤال
Scenario 1: The demand model relating the quantity of good XYZ sold QXYZ) to the price of good PXYZ) is reported below:
QXYZ = 4.46 + .304 PXYZ
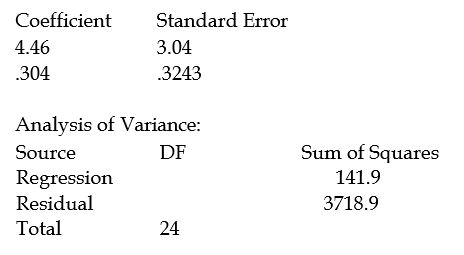
-Refer to Scenario 1. What is the total sum of squares?
A) 3860.8
B) 3718.9
C) 141.9
D) none of the above.
QXYZ = 4.46 + .304 PXYZ
-Refer to Scenario 1. What is the total sum of squares?
A) 3860.8
B) 3718.9
C) 141.9
D) none of the above.
سؤال
سؤال
سؤال
سؤال
سؤال
سؤال
سؤال
Scenario 1: The demand model relating the quantity of good XYZ sold QXYZ) to the price of good PXYZ) is reported below:
QXYZ = 4.46 + .304 PXYZ
-Refer to Scenario 1. Is the slope coefficient statistically different from zero?
A) No.
B) Yes.
C) Inconclusive.
D) None of the above.
QXYZ = 4.46 + .304 PXYZ
-Refer to Scenario 1. Is the slope coefficient statistically different from zero?
A) No.
B) Yes.
C) Inconclusive.
D) None of the above.
سؤال
سؤال
سؤال
سؤال
Scenario 1: The demand model relating the quantity of good XYZ sold QXYZ) to the price of good PXYZ) is reported below:
QXYZ = 4.46 + .304 PXYZ
-Refer to Scenario 1. What is the t-statistic for the slope coefficient?
A) 3.04
B) 0.94
C) 0.30
D) 4.46
QXYZ = 4.46 + .304 PXYZ
-Refer to Scenario 1. What is the t-statistic for the slope coefficient?
A) 3.04
B) 0.94
C) 0.30
D) 4.46
سؤال
سؤال
سؤال
Scenario 1: The demand model relating the quantity of good XYZ sold QXYZ) to the price of good PXYZ) is reported below:
QXYZ = 4.46 + .304 PXYZ
-Refer to Scenario 1. What is the coefficient of determination?
A) 1.000
B) 0.000
C) 0.037
D) 0.324
QXYZ = 4.46 + .304 PXYZ
-Refer to Scenario 1. What is the coefficient of determination?
A) 1.000
B) 0.000
C) 0.037
D) 0.324
سؤال
سؤال
سؤال
سؤال
سؤال
سؤال
سؤال
سؤال
سؤال
سؤال
سؤال
سؤال
سؤال
سؤال
سؤال
سؤال
سؤال
سؤال
سؤال
سؤال
سؤال

فتح الحزمة
قم بالتسجيل لفتح البطاقات في هذه المجموعة!
Unlock Deck
Unlock Deck
1/60
العب
ملء الشاشة (f)
Deck 4: Techniques for Understanding Consumer Demand and Behavior
1
Which of the following approaches to understanding and predicting consumer behavior provides the most insight into how consumers can be expected to respond in an actual market setting?
A) Test marketing.
B) Conjoint analysis.
C) Analysis of historical data.
D) Expert opinion.
A) Test marketing.
B) Conjoint analysis.
C) Analysis of historical data.
D) Expert opinion.
A
2
The least squares regression is based on:
A) maximizing the absolute sum of squares errors.
B) minimizing the absolute sum of squares errors.
C) maximizing the sum of squared errors.
D) minimizing the sum of squared errors.
A) maximizing the absolute sum of squares errors.
B) minimizing the absolute sum of squares errors.
C) maximizing the sum of squared errors.
D) minimizing the sum of squared errors.
D
3
Data collected on the same observation unit at a number of points in time are called:
A) cross-section data.
B) time series data.
C) panel data.
D) none of the above.
A) cross-section data.
B) time series data.
C) panel data.
D) none of the above.
B
4
Regression analysis that analyzes the relationship between one dependent variable and several independent variables is called:
A) simple regression analysis.
B) correlation analysis.
C) multiple regression analysis.
D) cluster analysis.
A) simple regression analysis.
B) correlation analysis.
C) multiple regression analysis.
D) cluster analysis.
فتح الحزمة
افتح القفل للوصول البطاقات البالغ عددها 60 في هذه المجموعة.
فتح الحزمة
k this deck
5
Which of the following approaches to understanding and predicting consumer behavior does not actually solicit any information from potential customers?
A) Test marketing.
B) Conjoint analysis.
C) Analysis of historical data.
D) Expert opinion.
A) Test marketing.
B) Conjoint analysis.
C) Analysis of historical data.
D) Expert opinion.
فتح الحزمة
افتح القفل للوصول البطاقات البالغ عددها 60 في هذه المجموعة.
فتح الحزمة
k this deck
6
The approach to analyzing consumer behavior that asks consumers to rank and choose among different product attributes to reveal their relative valuation of different characteristics is called:
A) a direct consumer survey.
B) contingent valuation.
C) the hedonic estimation technique.
D) conjoint analysis.
A) a direct consumer survey.
B) contingent valuation.
C) the hedonic estimation technique.
D) conjoint analysis.
فتح الحزمة
افتح القفل للوصول البطاقات البالغ عددها 60 في هذه المجموعة.
فتح الحزمة
k this deck
7
An approach to analyzing consumer behavior in which consumer reaction to different prices is analyzed in a laboratory situation or a test market is called:
A) price experiments.
B) non-price experiments.
C) focus groups.
D) none of the above.
A) price experiments.
B) non-price experiments.
C) focus groups.
D) none of the above.
فتح الحزمة
افتح القفل للوصول البطاقات البالغ عددها 60 في هذه المجموعة.
فتح الحزمة
k this deck
8
The number of observations minus the number of estimated coefficients in a regression equation is called:
A) degrees of freedom.
B) variance.
C) standard error fo the regression.
D) none of the above.
A) degrees of freedom.
B) variance.
C) standard error fo the regression.
D) none of the above.
فتح الحزمة
افتح القفل للوصول البطاقات البالغ عددها 60 في هذه المجموعة.
فتح الحزمة
k this deck
9
The test statistic used to test the hypothesis of whether a regression coefficient is significantly different from zero, holding all other independent variables constant, is called an):
A) F-test.
B) autocorrelation test.
C) multicollinearity test.
D) t-test.
A) F-test.
B) autocorrelation test.
C) multicollinearity test.
D) t-test.
فتح الحزمة
افتح القفل للوصول البطاقات البالغ عددها 60 في هذه المجموعة.
فتح الحزمة
k this deck
10
All of the following are limitations of direct consumer surveys except:
A) the possibility that consumers' responses may not reflect their actual behavior in the market place.
B) the possibility of response biases because survey respondents may not want to reveal their true preferences.
C) the likelihood that respondents will deliberately and systematically mislead interviewers.
D) the possibility that the type of questions asked may unintentionally bias the respondent's answers.
فتح الحزمة
افتح القفل للوصول البطاقات البالغ عددها 60 في هذه المجموعة.
فتح الحزمة
k this deck
11
Data collected on a sample of individuals with different characteristics at a specific point in time are called:
A) cross-section data.
B) time series data.
C) panel data.
D) none of the above.
A) cross-section data.
B) time series data.
C) panel data.
D) none of the above.
فتح الحزمة
افتح القفل للوصول البطاقات البالغ عددها 60 في هذه المجموعة.
فتح الحزمة
k this deck
12
You have the following demand equation for a pack of cigarettes: Q = 200 - 0.30P with the average quantity 3 packs and average price $3.00 per pack. What is the price elasticity?
A) 0.30
B) -0.30
C) 1.0
D) -1.0
A) 0.30
B) -0.30
C) 1.0
D) -1.0
فتح الحزمة
افتح القفل للوصول البطاقات البالغ عددها 60 في هذه المجموعة.
فتح الحزمة
k this deck
13
Which of the following statements is correct?
A) The use of Census data is especially useful and cost-effective in targeted marketing.
B) Census data are considered more reliable than data collected via direct consumer surveys because people are more likely to provide accurate responses to government census takers.
C) While the use of census data in targeting marketing can provide relatively accurate information, experience has shown that it has the disadvantage of increasing marketing costs by a substantial amount.
D) While census data are considerably less expensive than data obtained via direct consumer surveys, they are also considerably less reliable.
فتح الحزمة
افتح القفل للوصول البطاقات البالغ عددها 60 في هذه المجموعة.
فتح الحزمة
k this deck
14
A measure of how much the coefficient would vary in regressions based on different samples is called:
A) standard error of the estimated coefficient.
B) F-statistic.
C) partial F-statistic.
D) t-statistic.
A) standard error of the estimated coefficient.
B) F-statistic.
C) partial F-statistic.
D) t-statistic.
فتح الحزمة
افتح القفل للوصول البطاقات البالغ عددها 60 في هذه المجموعة.
فتح الحزمة
k this deck
15
In which of the following situations would reliance on expert opinion as a basis for a managerial decision be most preferred?
A) When the product can be packaged with a variety of price and quality combinations.
B) When the business in question serves as a supplier of inputs to other businesses, especially in multi-product situations where other strategies may be prohibitively expensive.
C) When the level of economic activity can have a significant effect on the demand for the firm's output.
D) When the product being marketed is relatively new.
فتح الحزمة
افتح القفل للوصول البطاقات البالغ عددها 60 في هذه المجموعة.
فتح الحزمة
k this deck
16
The ratio of the regression coefficient to its standard error is called:
A) t-statistic.
B) F-statistic.
C) partial F-statistic.
D) coefficient of determination.
A) t-statistic.
B) F-statistic.
C) partial F-statistic.
D) coefficient of determination.
فتح الحزمة
افتح القفل للوصول البطاقات البالغ عددها 60 في هذه المجموعة.
فتح الحزمة
k this deck
17
Regressional analysis that analyzes the relationship between one dependent variable and one independent variable is called:
A) simple regression analysis.
B) correlation analysis
C) multiple regression analysis.
D) cluster analysis.
A) simple regression analysis.
B) correlation analysis
C) multiple regression analysis.
D) cluster analysis.
فتح الحزمة
افتح القفل للوصول البطاقات البالغ عددها 60 في هذه المجموعة.
فتح الحزمة
k this deck
18
Which of the following approaches to understanding and predicting consumer behavior depends primarily on the knowledge and experience of a firm's employees and its suppliers?
A) Direct consumer surveys.
B) Expert opinion.
C) Analysis of historical data.
D) Test marketing and price experiments
A) Direct consumer surveys.
B) Expert opinion.
C) Analysis of historical data.
D) Test marketing and price experiments
فتح الحزمة
افتح القفل للوصول البطاقات البالغ عددها 60 في هذه المجموعة.
فتح الحزمة
k this deck
19
The coefficient of determination is defined as the
A) ratio of the total sum of squared errors to the sum of squared errors.
B) ratio of the regression sum of squares to the sum of the squared errors.
C) ratio of the sum of squared errors to the total sum of squared errors.
D) none of the above.
A) ratio of the total sum of squared errors to the sum of squared errors.
B) ratio of the regression sum of squares to the sum of the squared errors.
C) ratio of the sum of squared errors to the total sum of squared errors.
D) none of the above.
فتح الحزمة
افتح القفل للوصول البطاقات البالغ عددها 60 في هذه المجموعة.
فتح الحزمة
k this deck
20
Cross-sectional data observed at several points in time is known as:
A) time series data.
B) panel data.
C) experimental data.
D) none of the above.
A) time series data.
B) panel data.
C) experimental data.
D) none of the above.
فتح الحزمة
افتح القفل للوصول البطاقات البالغ عددها 60 في هذه المجموعة.
فتح الحزمة
k this deck
21
Given the demand function in log-linear form: Q = 120 - 1.5P + 12ADV where Q = quantity, P = price, and ADV = advertising expenditures, what is the price elasticity?
A) 1.5, inelastic
B) -1.5, elastic
C) 120, elastic
D) 12, elastic
A) 1.5, inelastic
B) -1.5, elastic
C) 120, elastic
D) 12, elastic
فتح الحزمة
افتح القفل للوصول البطاقات البالغ عددها 60 في هذه المجموعة.
فتح الحزمة
k this deck
22
An estimated regression coefficient is 10 with a standard error of 5. The null hypothesis is that the partial regression coefficient equals one. What is the value of the t-statistic for testing the null hypothesis of the regression coefficient?
A) 1
B) 2
C) 1.8
D) 0.5
A) 1
B) 2
C) 1.8
D) 0.5
فتح الحزمة
افتح القفل للوصول البطاقات البالغ عددها 60 في هذه المجموعة.
فتح الحزمة
k this deck
23
When using expert opinion, consumer surveys, test marketing, and price experiments to analyze consumer behavior, managers must consider how to isolate the effect of different variables that influence demand.
فتح الحزمة
افتح القفل للوصول البطاقات البالغ عددها 60 في هذه المجموعة.
فتح الحزمة
k this deck
24
The estimated regression equation is Y = 10 + 2.5X, if X =0 than the predicted value of Y is equal to:
A) 12.5
B) 10
C) 2.5
D) 7.5
A) 12.5
B) 10
C) 2.5
D) 7.5
فتح الحزمة
افتح القفل للوصول البطاقات البالغ عددها 60 في هذه المجموعة.
فتح الحزمة
k this deck
25
Scenario 1: The demand model relating the quantity of good XYZ sold QXYZ) to the price of good PXYZ) is reported below:
QXYZ = 4.46 + .304 PXYZ
-Refer to Scenario 1. What is the total sum of squares?
A) 3860.8
B) 3718.9
C) 141.9
D) none of the above.
QXYZ = 4.46 + .304 PXYZ
-Refer to Scenario 1. What is the total sum of squares?
A) 3860.8
B) 3718.9
C) 141.9
D) none of the above.
فتح الحزمة
افتح القفل للوصول البطاقات البالغ عددها 60 في هذه المجموعة.
فتح الحزمة
k this deck
26
In a multiple regression problem involving two independent variables, if b1 is computed to be +2.0, it means that:
A) the relationship between X1 and Y is significant.
B) the estimated value of Y increases by an average of 2 units for each increase of 1 unit of X1, holding X2 constant.
C) the estimated value of Y increases by an average of 2 units for each increase of 1 unit of X1, without regard to X2.
D) the estimated average value of Y is 2 when X1 equals zero.
فتح الحزمة
افتح القفل للوصول البطاقات البالغ عددها 60 في هذه المجموعة.
فتح الحزمة
k this deck
27
A constant-elasticity demand function can be obtained by:
A) taking the logarithm of the dependent variable only.
B) taking the logarithm of the independent variables) only.
C) taking the logarithm of the dependent and independent variables).
D) taking the reciprocal of the dependent variables).
A) taking the logarithm of the dependent variable only.
B) taking the logarithm of the independent variables) only.
C) taking the logarithm of the dependent and independent variables).
D) taking the reciprocal of the dependent variables).
فتح الحزمة
افتح القفل للوصول البطاقات البالغ عددها 60 في هذه المجموعة.
فتح الحزمة
k this deck
28
The coefficient of determination will range between what values?
A) 0 and 1
B) -1 and +1
C) -3 and +3
D) none of the above
A) 0 and 1
B) -1 and +1
C) -3 and +3
D) none of the above
فتح الحزمة
افتح القفل للوصول البطاقات البالغ عددها 60 في هذه المجموعة.
فتح الحزمة
k this deck
29
Conjoint analysis employs an approach to consumer behavior that is similar to the economic indifference curve model.
فتح الحزمة
افتح القفل للوصول البطاقات البالغ عددها 60 في هذه المجموعة.
فتح الحزمة
k this deck
30
When using expert opinion, consumer surveys, test marketing, and price experiments to analyze consumer behavior, managers must consider whether the participating groups are representative of the larger population.
فتح الحزمة
افتح القفل للوصول البطاقات البالغ عددها 60 في هذه المجموعة.
فتح الحزمة
k this deck
31
Reliance on expert opinion to predict consumer behavior has the advantage of being a relatively low cost approach to gathering information. In many situations, however, it is subject to several sources of bias that can undermine its reliability.
فتح الحزمة
افتح القفل للوصول البطاقات البالغ عددها 60 في هذه المجموعة.
فتح الحزمة
k this deck
32
Scenario 1: The demand model relating the quantity of good XYZ sold QXYZ) to the price of good PXYZ) is reported below:
QXYZ = 4.46 + .304 PXYZ
-Refer to Scenario 1. Is the slope coefficient statistically different from zero?
A) No.
B) Yes.
C) Inconclusive.
D) None of the above.
QXYZ = 4.46 + .304 PXYZ
-Refer to Scenario 1. Is the slope coefficient statistically different from zero?
A) No.
B) Yes.
C) Inconclusive.
D) None of the above.
فتح الحزمة
افتح القفل للوصول البطاقات البالغ عددها 60 في هذه المجموعة.
فتح الحزمة
k this deck
33
The coefficient of determination is .90, the number of observations is 30, and a multiple regression model using 2 independent variables is estimated. What is the value of the adjusted coefficient of determination?
A) )8926
B) )9000
C) )7500
D) )8000
A) )8926
B) )9000
C) )7500
D) )8000
فتح الحزمة
افتح القفل للوصول البطاقات البالغ عددها 60 في هذه المجموعة.
فتح الحزمة
k this deck
34
An estimated regression coefficient is 10 with a standard error of 5. The null hypothesis is that the partial regression coefficient equals zero. What is the value of the t-statistic for testing the null hypothesis of the regression coefficient?
A) 1
B) 2
C) 0.5
D) 5
A) 1
B) 2
C) 0.5
D) 5
فتح الحزمة
افتح القفل للوصول البطاقات البالغ عددها 60 في هذه المجموعة.
فتح الحزمة
k this deck
35
When using expert opinion, consumer surveys, test marketing, and price experiments to analyze consumer behavior, managers must consider whether the answers given in these formats represent actual market behavior.
فتح الحزمة
افتح القفل للوصول البطاقات البالغ عددها 60 في هذه المجموعة.
فتح الحزمة
k this deck
36
Scenario 1: The demand model relating the quantity of good XYZ sold QXYZ) to the price of good PXYZ) is reported below:
QXYZ = 4.46 + .304 PXYZ
-Refer to Scenario 1. What is the t-statistic for the slope coefficient?
A) 3.04
B) 0.94
C) 0.30
D) 4.46
QXYZ = 4.46 + .304 PXYZ
-Refer to Scenario 1. What is the t-statistic for the slope coefficient?
A) 3.04
B) 0.94
C) 0.30
D) 4.46
فتح الحزمة
افتح القفل للوصول البطاقات البالغ عددها 60 في هذه المجموعة.
فتح الحزمة
k this deck
37
The total sum of squares is 400 and the sum of squares errors is 100, what is the coefficient of determination?
A) 25
B) 0.75
C) 1.00
D) 0
A) 25
B) 0.75
C) 1.00
D) 0
فتح الحزمة
افتح القفل للوصول البطاقات البالغ عددها 60 في هذه المجموعة.
فتح الحزمة
k this deck
38
The range of values in which we can be confident that the true regression coefficient lies within a given degree of probability is called a:
A) prediction interval.
B) confidence interval.
C) logistic regression.
D) none of the above.
A) prediction interval.
B) confidence interval.
C) logistic regression.
D) none of the above.
فتح الحزمة
افتح القفل للوصول البطاقات البالغ عددها 60 في هذه المجموعة.
فتح الحزمة
k this deck
39
Scenario 1: The demand model relating the quantity of good XYZ sold QXYZ) to the price of good PXYZ) is reported below:
QXYZ = 4.46 + .304 PXYZ
-Refer to Scenario 1. What is the coefficient of determination?
A) 1.000
B) 0.000
C) 0.037
D) 0.324
QXYZ = 4.46 + .304 PXYZ
-Refer to Scenario 1. What is the coefficient of determination?
A) 1.000
B) 0.000
C) 0.037
D) 0.324
فتح الحزمة
افتح القفل للوصول البطاقات البالغ عددها 60 في هذه المجموعة.
فتح الحزمة
k this deck
40
The F-statistic is an alternative measure of goodness-of-fit of an estimated regression equation and defined as the
A) variation not explained by the regression equation relative to the variation explained.
B) variation explained by the regression equation to the variation not explained.
C) variation explained.
D) variation not explained.
A) variation not explained by the regression equation relative to the variation explained.
B) variation explained by the regression equation to the variation not explained.
C) variation explained.
D) variation not explained.
فتح الحزمة
افتح القفل للوصول البطاقات البالغ عددها 60 في هذه المجموعة.
فتح الحزمة
k this deck
41
The overall predictive power of the estimated regression equation is measured by the F-statistic.
فتح الحزمة
افتح القفل للوصول البطاقات البالغ عددها 60 في هذه المجموعة.
فتح الحزمة
k this deck
42
The t-test is used to test hypotheses concerning the regression coefficients.
فتح الحزمة
افتح القفل للوصول البطاقات البالغ عددها 60 في هذه المجموعة.
فتح الحزمة
k this deck
43
Why are estimated models of demand and consumer behavior useful to managers?
فتح الحزمة
افتح القفل للوصول البطاقات البالغ عددها 60 في هذه المجموعة.
فتح الحزمة
k this deck
44
Elaborate on the statement "Every multiple regression analysis is influenced by the sample of the data used".
فتح الحزمة
افتح القفل للوصول البطاقات البالغ عددها 60 في هذه المجموعة.
فتح الحزمة
k this deck
45
Adding an independent variable to a regression model will always reduce the coefficient of determination.
فتح الحزمة
افتح القفل للوصول البطاقات البالغ عددها 60 في هذه المجموعة.
فتح الحزمة
k this deck
46
What are the effects of two independent variables that are highly correlated? What can be done to remedy the problem?
فتح الحزمة
افتح القفل للوصول البطاقات البالغ عددها 60 في هذه المجموعة.
فتح الحزمة
k this deck
47
Briefly explain why empirical consumer demand studies such as Patrick McCarthy's study of automobile demand are relevant to managers.
فتح الحزمة
افتح القفل للوصول البطاقات البالغ عددها 60 في هذه المجموعة.
فتح الحزمة
k this deck
48
Cross-section data observed at several points in time are called inverted data.
فتح الحزمة
افتح القفل للوصول البطاقات البالغ عددها 60 في هذه المجموعة.
فتح الحزمة
k this deck
49
The intercept of the equation: Y = .09 + 1.5X is 1.5.
فتح الحزمة
افتح القفل للوصول البطاقات البالغ عددها 60 في هذه المجموعة.
فتح الحزمة
k this deck
50
Adjusted R2 gives the actual percentage of the variation in the dependent variable explained by the regression model.
فتح الحزمة
افتح القفل للوصول البطاقات البالغ عددها 60 في هذه المجموعة.
فتح الحزمة
k this deck
51
Regression analysis is used for prediction, while correlation analysis is used to measure the strength of the association between two variables.
فتح الحزمة
افتح القفل للوصول البطاقات البالغ عددها 60 في هذه المجموعة.
فتح الحزمة
k this deck
52
The coefficient of determination is the proportion of the variation that is not explained by the regression model.
فتح الحزمة
افتح القفل للوصول البطاقات البالغ عددها 60 في هذه المجموعة.
فتح الحزمة
k this deck
53
The statistical significance of the slope coefficient can only be tested using the F test.
فتح الحزمة
افتح القفل للوصول البطاقات البالغ عددها 60 في هذه المجموعة.
فتح الحزمة
k this deck
54
Log-linear demand function is also called a constant-elasticity demand function.
فتح الحزمة
افتح القفل للوصول البطاقات البالغ عددها 60 في هذه المجموعة.
فتح الحزمة
k this deck
55
Least squares regression minimizes the sum of the absolute errors.
فتح الحزمة
افتح القفل للوصول البطاقات البالغ عددها 60 في هذه المجموعة.
فتح الحزمة
k this deck
56
The total sum of squares equals the sum of squares of the variation explained by the regression and the sum of squares of the errors.
فتح الحزمة
افتح القفل للوصول البطاقات البالغ عددها 60 في هذه المجموعة.
فتح الحزمة
k this deck
57
Briefly describe the three key points managers must consider when using expert opinion, consumer surveys, test marketing, and price experiments in analyzing consumer behavior.
فتح الحزمة
افتح القفل للوصول البطاقات البالغ عددها 60 في هذه المجموعة.
فتح الحزمة
k this deck
58
The degrees of freedom in a regression equation is the number of observations minus the number of estimated coefficients.
فتح الحزمة
افتح القفل للوصول البطاقات البالغ عددها 60 في هذه المجموعة.
فتح الحزمة
k this deck
59
The coefficient of determination represents the ratio of the regression sum of squares to the total sum of squares.
فتح الحزمة
افتح القفل للوصول البطاقات البالغ عددها 60 في هذه المجموعة.
فتح الحزمة
k this deck
60
Price elasticities tend to be higher, the greater the number of substitutes.
فتح الحزمة
افتح القفل للوصول البطاقات البالغ عددها 60 في هذه المجموعة.
فتح الحزمة
k this deck
فتح الحزمة
افتح القفل للوصول البطاقات البالغ عددها 60 في هذه المجموعة.


