Deck 10: Describing Relationships Using Correlation and Regression
ملء الشاشة (f)
سؤال
سؤال
سؤال
سؤال
سؤال
سؤال
سؤال
سؤال
سؤال
سؤال
سؤال
سؤال
سؤال
سؤال
سؤال
سؤال
سؤال
سؤال
سؤال
سؤال
سؤال
What kind of relationship is depicted in the following graph? 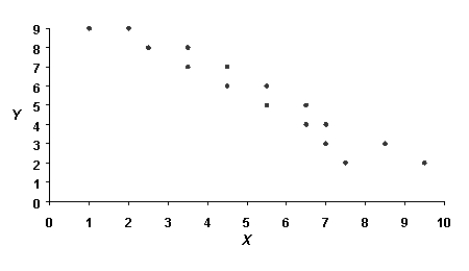
سؤال
سؤال
سؤال
سؤال
What kind of relationship is depicted in the following graph? 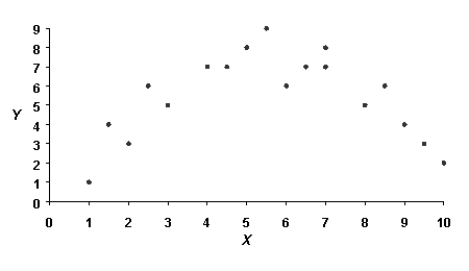
سؤال
سؤال
سؤال
What kind of relationship is depicted in the following graph? 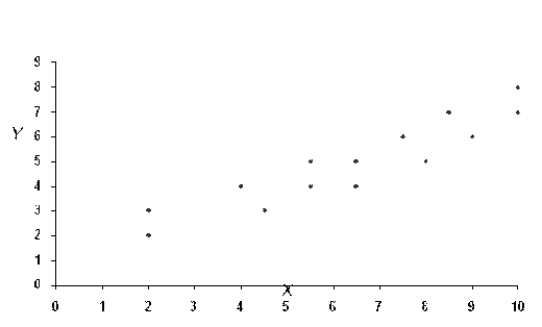
سؤال
Use the following data set and conduct a two-tailed test of significance on the Pearson r.Use  = .05.
a.What are your null and alternative hypotheses?
b.What are your degrees of freedom?
c.What is the critical value?
d.Calculate the Pearson r
e.What do you conclude?
= .05. a.What are your null and alternative hypotheses?
b.What are your degrees of freedom?
c.What is the critical value?
d.Calculate the Pearson r
e.What do you conclude?
سؤال
What type of relationship does the following regression line represent? 
سؤال
سؤال
سؤال
What kind of relationship is depicted in the following graph? 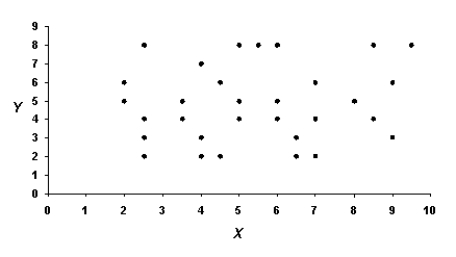
سؤال
What type of relationship does the following regression line represent? 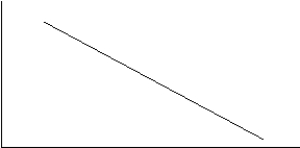
سؤال
Use the following data set and conduct a two-tailed test of significance on the Pearson r.Use  = .05.
a.What are your null and alternative hypotheses?
b.What are your degrees of freedom?
c.What is the critical value?
d.Calculate the Pearson r
e.What do you conclude?
= .05. a.What are your null and alternative hypotheses?
b.What are your degrees of freedom?
c.What is the critical value?
d.Calculate the Pearson r
e.What do you conclude?
سؤال
سؤال
What type of relationship does the following regression line represent? 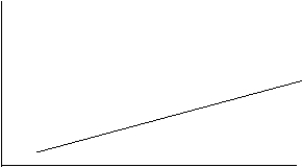
سؤال
سؤال
Use the following data set and conduct a one-tailed test of significance in the upper tail on the Pearson r.Use  =
=
.05.
a.What are your null and alternative hypotheses?
b.What are your degrees of freedom?
c.What is the critical value?
d.Calculate the Pearson r
e.What do you conclude?
=.05.
a.What are your null and alternative hypotheses?
b.What are your degrees of freedom?
c.What is the critical value?
d.Calculate the Pearson r
e.What do you conclude?
سؤال

فتح الحزمة
قم بالتسجيل لفتح البطاقات في هذه المجموعة!
Unlock Deck
Unlock Deck
1/40
العب
ملء الشاشة (f)
Deck 10: Describing Relationships Using Correlation and Regression
1
What does a correlation coefficient do?
A)It allows us to draw conclusions about whether one variable causes another variable.
B)It creates a correlational design, rather than an experimental design.
C)It simplifies a complex pattern involving many scores into one easily interpreted statistic.
D)It summarizes the X scores and the Y scores separately.
C
2
When the correlation coefficient representing the relationship between X and Y is intermediate, then all of the following are true except
A)there is not a perfectly consistent association.
B)there are different Y scores associated with a single X score.
C)prediction of Y from a known X score has some error.
D)all data points fall on the regression line.
A)there is not a perfectly consistent association.
B)there are different Y scores associated with a single X score.
C)prediction of Y from a known X score has some error.
D)all data points fall on the regression line.
D
3
Dr.Johnston has calculated a correlation between the number of cigarettes smoked per week and the age of his patients at the point of their first heart attack as r = -0.92.Dr.Johnston and his associates claim there apparently is no relationship between smoking and heart attacks.What error has Dr.Johnson made?
A)No error has been made; an r = -0.92 is so close to 0 that there is no relationship.
B)A correlation coefficient this close to -1 means there probably is a relationship, but we probably should do a significance test just to be sure.
C)Not everyone who smokes has a heart attack.
D)Dr.Johnston should know there are numerous factors involved when a person has a heart attack.
B
4
"The more you save, the less you spend" describes
A)a positive linear correlation.
B)a negative linear correlation.
C)no correlation.
D)a nonlinear correlation.
A)a positive linear correlation.
B)a negative linear correlation.
C)no correlation.
D)a nonlinear correlation.
فتح الحزمة
افتح القفل للوصول البطاقات البالغ عددها 40 في هذه المجموعة.
فتح الحزمة
k this deck
5
The best-fitting line through a scatterplot is known as the
A)linear scatterplot line.
B)linear correlation line.
C)linear variance line.
D)linear regression line.
A)linear scatterplot line.
B)linear correlation line.
C)linear variance line.
D)linear regression line.
فتح الحزمة
افتح القفل للوصول البطاقات البالغ عددها 40 في هذه المجموعة.
فتح الحزمة
k this deck
6
In general, a positive correlation means as the values of one variable , there is a tendency for the values of the other variable to .
A)increase; increase
B)increase; decrease
C)decrease; increase
D)decrease; decrease
A)increase; increase
B)increase; decrease
C)decrease; increase
D)decrease; decrease
فتح الحزمة
افتح القفل للوصول البطاقات البالغ عددها 40 في هذه المجموعة.
فتح الحزمة
k this deck
7
A linear regression procedure should ultimately yield a value called
A)Y prime.
B)rho.
C)the slope.
D)the proportion of variance accounted for.
A)Y prime.
B)rho.
C)the slope.
D)the proportion of variance accounted for.
فتح الحزمة
افتح القفل للوصول البطاقات البالغ عددها 40 في هذه المجموعة.
فتح الحزمة
k this deck
8
When plotting correlational data, the appropriate graph to use is the
A)line graph.
B)bar graph.
C)histogram.
D)scatterplot.
A)line graph.
B)bar graph.
C)histogram.
D)scatterplot.
فتح الحزمة
افتح القفل للوصول البطاقات البالغ عددها 40 في هذه المجموعة.
فتح الحزمة
k this deck
9
"The bigger they are, the harder they fall" describes
A)a positive linear correlation.
B)a negative linear correlation.
C)no correlation.
D)a nonlinear correlation.
A)a positive linear correlation.
B)a negative linear correlation.
C)no correlation.
D)a nonlinear correlation.
فتح الحزمة
افتح القفل للوصول البطاقات البالغ عددها 40 في هذه المجموعة.
فتح الحزمة
k this deck
10
If you have a Pearson correlation coefficient of .30, what is the proportion of variance accounted for?
A).09
B).90
C).60
D).30
A).09
B).90
C).60
D).30
فتح الحزمة
افتح القفل للوصول البطاقات البالغ عددها 40 في هذه المجموعة.
فتح الحزمة
k this deck
11
The values of rho are
A)between -1 and +1.
B)unrestricted.
C)between 0 and +1.
D)any positive number.
A)between -1 and +1.
B)unrestricted.
C)between 0 and +1.
D)any positive number.
فتح الحزمة
افتح القفل للوصول البطاقات البالغ عددها 40 في هذه المجموعة.
فتح الحزمة
k this deck
12
Which of the following r-values indicates the weakest relationship between two variables?
A)+0.45
B)-0.30
C)+0.03
D)-0.45
A)+0.45
B)-0.30
C)+0.03
D)-0.45
فتح الحزمة
افتح القفل للوصول البطاقات البالغ عددها 40 في هذه المجموعة.
فتح الحزمة
k this deck
13
Which relationship is stronger, r = +0.62 or r = -0.62?
A)An r = +0.62 represents a stronger relationship than r = -0.62.
B)An r = -0.62 represents a stronger relationship than r = +0.62.
C)There is no difference in the strength of the two relationships.
D)Without seeing a scatterplot of the data, there is no way to determine which is stronger.
A)An r = +0.62 represents a stronger relationship than r = -0.62.
B)An r = -0.62 represents a stronger relationship than r = +0.62.
C)There is no difference in the strength of the two relationships.
D)Without seeing a scatterplot of the data, there is no way to determine which is stronger.
فتح الحزمة
افتح القفل للوصول البطاقات البالغ عددها 40 في هذه المجموعة.
فتح الحزمة
k this deck
14
Professor Miller has found the correlation between a person's "need for affiliation" found by taking a test to determine the need to be with others) and the number of hours spent watching television is −0.69.He should conclude
A)as we observe people with higher and higher need for affiliation, we see a tendency for those people to spend less and less time watching television.
B)there is not much of a relationship between the two variables because the r is negative.
C)as we observe people with higher and higher need for affiliation, we see a tendency for those people to spend more and more time watching television.
D)the people who watch more television tend to have more need to be around others.
فتح الحزمة
افتح القفل للوصول البطاقات البالغ عددها 40 في هذه المجموعة.
فتح الحزمة
k this deck
15
Which of the following r-values indicates the strongest relationship between two variables?
A)+0.65
B)-0.89
C)+0.10
D)-0.10
A)+0.65
B)-0.89
C)+0.10
D)-0.10
فتح الحزمة
افتح القفل للوصول البطاقات البالغ عددها 40 في هذه المجموعة.
فتح الحزمة
k this deck
16
We should do a scatterplot of the data when we compute a correlation because the scatterplot allows us to
A)see the particular relationship and map out the best way to summarize it.
B)determine the exact value of the correlation coefficient.
C)determine whether a relationship is likely to exist in the population from which the sample is taken.
D)predict accurate Y scores for known X scores.
A)see the particular relationship and map out the best way to summarize it.
B)determine the exact value of the correlation coefficient.
C)determine whether a relationship is likely to exist in the population from which the sample is taken.
D)predict accurate Y scores for known X scores.
فتح الحزمة
افتح القفل للوصول البطاقات البالغ عددها 40 في هذه المجموعة.
فتح الحزمة
k this deck
17
A U-shaped pattern is an example of a
A)curvilinear relationship.
B)non-relationship.
C)positive relationship.
D)negative relationship.
A)curvilinear relationship.
B)non-relationship.
C)positive relationship.
D)negative relationship.
فتح الحزمة
افتح القفل للوصول البطاقات البالغ عددها 40 في هذه المجموعة.
فتح الحزمة
k this deck
18
In general, a zero correlation means
A)as the values of one variable increase, there is no tendency for the values of the other variable to change in any consistent, predictable fashion.
B)as the values of one variable increase, there is a tendency for the values of the other variable also to increase.
C)as the values of one variable increase, there is a tendency for the values of the other variable to decrease.
D)as the values of one variable decrease, there is a tendency for the values of the other variable also to decrease.
فتح الحزمة
افتح القفل للوصول البطاقات البالغ عددها 40 في هذه المجموعة.
فتح الحزمة
k this deck
19
In a linear relationship, as the X scores increase, the Y scores change
A)in only one direction.
B)only in the negative direction.
C)only in the positive direction.
D)in the positive and then in the negative direction.
A)in only one direction.
B)only in the negative direction.
C)only in the positive direction.
D)in the positive and then in the negative direction.
فتح الحزمة
افتح القفل للوصول البطاقات البالغ عددها 40 في هذه المجموعة.
فتح الحزمة
k this deck
20
What are the consequences of having a restricted range?
A)Obtaining a smaller r than otherwise would be the case.
B)Obtaining a larger r than otherwise would be the case.
C)Having a curvilinear instead of a linear relationship.
D)Having a correlation with a different direction than otherwise would be found.
A)Obtaining a smaller r than otherwise would be the case.
B)Obtaining a larger r than otherwise would be the case.
C)Having a curvilinear instead of a linear relationship.
D)Having a correlation with a different direction than otherwise would be found.
فتح الحزمة
افتح القفل للوصول البطاقات البالغ عددها 40 في هذه المجموعة.
فتح الحزمة
k this deck
21
What kind of relationship is depicted in the following graph?
فتح الحزمة
افتح القفل للوصول البطاقات البالغ عددها 40 في هذه المجموعة.
فتح الحزمة
k this deck
22
Suppose you've done a study and you're writing up your results for presentation in an APA journal.You want to report a significant correlation of -.72 with degrees of freedom of 51.How would you report this?
فتح الحزمة
افتح القفل للوصول البطاقات البالغ عددها 40 في هذه المجموعة.
فتح الحزمة
k this deck
23
Suppose income and personal health are correlated at .35.What can you say about cause and effect?
فتح الحزمة
افتح القفل للوصول البطاقات البالغ عددها 40 في هذه المجموعة.
فتح الحزمة
k this deck
24
Suppose you find that sleepiness and happiness are correlated at -.65.What does this value tell us in terms of what percentage of happiness is not associated with sleepiness?
فتح الحزمة
افتح القفل للوصول البطاقات البالغ عددها 40 في هذه المجموعة.
فتح الحزمة
k this deck
25
What kind of relationship is depicted in the following graph?
فتح الحزمة
افتح القفل للوصول البطاقات البالغ عددها 40 في هذه المجموعة.
فتح الحزمة
k this deck
26
If the correlation coefficient for X and Y is calculated to be -.95, what is the proportion of variance accounted for?
فتح الحزمة
افتح القفل للوصول البطاقات البالغ عددها 40 في هذه المجموعة.
فتح الحزمة
k this deck
27
Suppose you are trying to predict how a child's IQ is impacted by their mother's IQ.State the criterion and predictor variables.
فتح الحزمة
افتح القفل للوصول البطاقات البالغ عددها 40 في هذه المجموعة.
فتح الحزمة
k this deck
28
What kind of relationship is depicted in the following graph?
فتح الحزمة
افتح القفل للوصول البطاقات البالغ عددها 40 في هذه المجموعة.
فتح الحزمة
k this deck
29
Use the following data set and conduct a two-tailed test of significance on the Pearson r.Use = .05.
a.What are your null and alternative hypotheses?
b.What are your degrees of freedom?
c.What is the critical value?
d.Calculate the Pearson r
e.What do you conclude?
= .05. a.What are your null and alternative hypotheses?
b.What are your degrees of freedom?
c.What is the critical value?
d.Calculate the Pearson r
e.What do you conclude?
فتح الحزمة
افتح القفل للوصول البطاقات البالغ عددها 40 في هذه المجموعة.
فتح الحزمة
k this deck
30
What type of relationship does the following regression line represent?
فتح الحزمة
افتح القفل للوصول البطاقات البالغ عددها 40 في هذه المجموعة.
فتح الحزمة
k this deck
31
If the proportion of variance accounted for is 36%, what is the correlation coefficient for X and Y?
فتح الحزمة
افتح القفل للوصول البطاقات البالغ عددها 40 في هذه المجموعة.
فتح الحزمة
k this deck
32
Suppose a researcher is trying to figure out how one's anxiety may predict depression scores.What are the criterion and predictor variables?
فتح الحزمة
افتح القفل للوصول البطاقات البالغ عددها 40 في هذه المجموعة.
فتح الحزمة
k this deck
33
What kind of relationship is depicted in the following graph?
فتح الحزمة
افتح القفل للوصول البطاقات البالغ عددها 40 في هذه المجموعة.
فتح الحزمة
k this deck
34
What type of relationship does the following regression line represent?
فتح الحزمة
افتح القفل للوصول البطاقات البالغ عددها 40 في هذه المجموعة.
فتح الحزمة
k this deck
35
Use the following data set and conduct a two-tailed test of significance on the Pearson r.Use = .05.
a.What are your null and alternative hypotheses?
b.What are your degrees of freedom?
c.What is the critical value?
d.Calculate the Pearson r
e.What do you conclude?
= .05. a.What are your null and alternative hypotheses?
b.What are your degrees of freedom?
c.What is the critical value?
d.Calculate the Pearson r
e.What do you conclude?
فتح الحزمة
افتح القفل للوصول البطاقات البالغ عددها 40 في هذه المجموعة.
فتح الحزمة
k this deck
36
Dr.Phillips has conducted a correlational study with 112 subjects.However, she only has X and Y values for 107 of these subjects.What are the degrees of freedom in this study?
فتح الحزمة
افتح القفل للوصول البطاقات البالغ عددها 40 في هذه المجموعة.
فتح الحزمة
k this deck
37
What type of relationship does the following regression line represent?
فتح الحزمة
افتح القفل للوصول البطاقات البالغ عددها 40 في هذه المجموعة.
فتح الحزمة
k this deck
38
Suppose you've calculated a Pearson correlation coefficient and had a final value of +10.How do you interpret this result?
فتح الحزمة
افتح القفل للوصول البطاقات البالغ عددها 40 في هذه المجموعة.
فتح الحزمة
k this deck
39
Use the following data set and conduct a one-tailed test of significance in the upper tail on the Pearson r.Use =
.05.
a.What are your null and alternative hypotheses?
b.What are your degrees of freedom?
c.What is the critical value?
d.Calculate the Pearson r
e.What do you conclude?
=.05.
a.What are your null and alternative hypotheses?
b.What are your degrees of freedom?
c.What is the critical value?
d.Calculate the Pearson r
e.What do you conclude?
فتح الحزمة
افتح القفل للوصول البطاقات البالغ عددها 40 في هذه المجموعة.
فتح الحزمة
k this deck
40
If the correlation coefficient for X and Y is calculated to be +.47, what is the proportion of variance accounted for?
فتح الحزمة
افتح القفل للوصول البطاقات البالغ عددها 40 في هذه المجموعة.
فتح الحزمة
k this deck
فتح الحزمة
افتح القفل للوصول البطاقات البالغ عددها 40 في هذه المجموعة.


