Deck 13: Glm 2: Comparing Means Adjusted for Other Predictors Analysis of Covariance
ملء الشاشة (f)
سؤال
Having run a simple contrast with the univariate test, interpret the following table and decide which of the following statements is most appropriate. 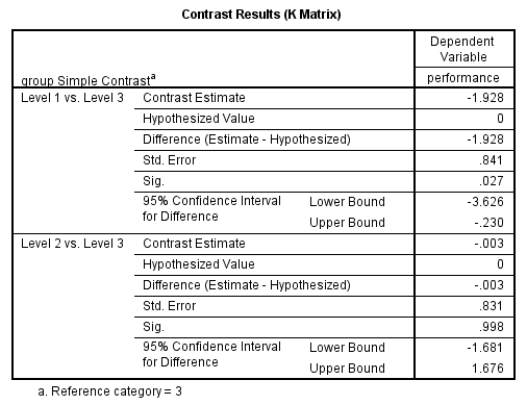
A) There was a statistically significant result for visual learning when compared with kinaesthetic learning.
B) There was a statistically significant result for auditory learning when compared with kinaesthetic learning.
C) There were no statistically significant results identified.
D) Both the visual and auditory learning styles were statistically significant when compared with kinaesthetic approach.
سؤال
Analyse the following table. How might you express the data as a multiple regression model when dummy variables are incorporated? 
A) Performance = 4.0+(1.5×Motivation)+(-1.9×visual)+(-0.003×auditory)
B) Performance = 4.0×(1.5×Motivation)×(-1.9×visual)×(-0.003×auditory)
C) Performance = 4.0×(1.5+Motivation)×(-1.9+visual)×(-0.003+auditory)
D) Performance = 4.0-(1.5/Motivation)-(-1.9/visual)-(-0.003/auditory)
A) Performance = 4.0+(1.5×Motivation)+(-1.9×visual)+(-0.003×auditory)
B) Performance = 4.0×(1.5×Motivation)×(-1.9×visual)×(-0.003×auditory)
C) Performance = 4.0×(1.5+Motivation)×(-1.9+visual)×(-0.003+auditory)
D) Performance = 4.0-(1.5/Motivation)-(-1.9/visual)-(-0.003/auditory)
سؤال
سؤال
سؤال
سؤال
سؤال
سؤال
سؤال
سؤال
Calculate the mean and standard deviation of the kinaesthetic group from the data below. 
A) 13(5)
B) 12(4)
C) 11(5)
D) 10(4)
A) 13(5)
B) 12(4)
C) 11(5)
D) 10(4)
سؤال
سؤال
سؤال
سؤال
Analyse the following data. What is the proportion of variance accounted for by the learning style alone? 
A) 4%
B) 5%
C) 40%
D) 50%
A) 4%
B) 5%
C) 40%
D) 50%
سؤال
سؤال
سؤال
Examine the table below. Based on the answer in Q20, calculate the partial eta squared for motivation. 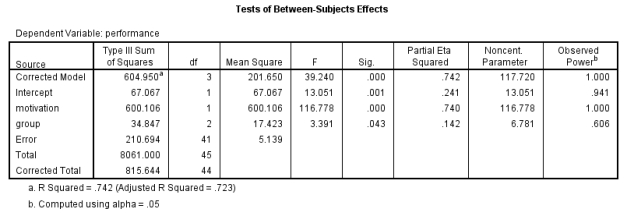
A) .14
B) .74
C) .24
D) .44
A) .14
B) .74
C) .24
D) .44
سؤال
سؤال
Analyse the following illustration. Which scenario is referable when trying to explain the impact a covariate has on an outcome variable? 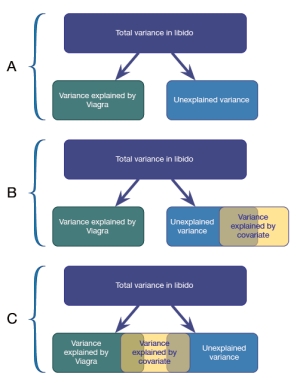
A) A
B) B
C) C
D) None of the scenarios are appropriate.
A) A
B) B
C) C
D) None of the scenarios are appropriate.
سؤال
Analyse the following graph. The data shows the results of three groups of 15 athletes who were instructed to complete a basketball shooting exercise (success rate from 20 free throw shots) having received one of three methods of instruction, auditory (shooting technique being verbally described by a coach), visual (shooting technique being verbally described by a coach) or kinaesthetic (no coaching, just asked to perform the shooting exercise). Motivation acted as the covariate of interest. How would you describe the regression slopes? 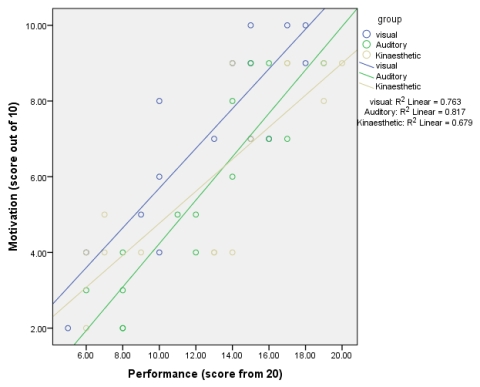
A) Positive and homogeneous
B) Positive and heterogeneous
C) Negative and homogeneous
D) Negative and heterogeneous
A) Positive and homogeneous
B) Positive and heterogeneous
C) Negative and homogeneous
D) Negative and heterogeneous
سؤال
How would you express the results of the learning style component of the ANCOVA?
A) F(2, 41) = 3.39, p = .04, = .14
= .14
B) F(2, 45) = 39.2, p = .04, = .24
= .24
C) F(1, 45) = 3.39, p = .00, = .74
= .74
D) F(2, 41) = 39.2, p = .04, = .44
= .44
A) F(2, 41) = 3.39, p = .04,
= .14B) F(2, 45) = 39.2, p = .04,
= .24C) F(1, 45) = 3.39, p = .00,
= .74D) F(2, 41) = 39.2, p = .04,
= .44 سؤال
How would you express the results of the motivation component of the ANCOVA?
A) F(1, 41) = 116.8, p < .001, = .74
= .74
B) F(1, 45) = 3.3, p = .043, = .84
= .84
C) F(1, 41) = 13, p = .001, = .64
= .64
D) F(1, 45) = 39.2, p < .001, = .54
= .54
A) F(1, 41) = 116.8, p < .001,
= .74B) F(1, 45) = 3.3, p = .043,
= .84C) F(1, 41) = 13, p = .001,
= .64D) F(1, 45) = 39.2, p < .001,
= .54
فتح الحزمة
قم بالتسجيل لفتح البطاقات في هذه المجموعة!
Unlock Deck
Unlock Deck
1/22
العب
ملء الشاشة (f)
Deck 13: Glm 2: Comparing Means Adjusted for Other Predictors Analysis of Covariance
1
Having run a simple contrast with the univariate test, interpret the following table and decide which of the following statements is most appropriate.
A) There was a statistically significant result for visual learning when compared with kinaesthetic learning.
B) There was a statistically significant result for auditory learning when compared with kinaesthetic learning.
C) There were no statistically significant results identified.
D) Both the visual and auditory learning styles were statistically significant when compared with kinaesthetic approach.
There was a statistically significant result for visual learning when compared with kinaesthetic learning.
2
Analyse the following table. How might you express the data as a multiple regression model when dummy variables are incorporated?
A) Performance = 4.0+(1.5×Motivation)+(-1.9×visual)+(-0.003×auditory)
B) Performance = 4.0×(1.5×Motivation)×(-1.9×visual)×(-0.003×auditory)
C) Performance = 4.0×(1.5+Motivation)×(-1.9+visual)×(-0.003+auditory)
D) Performance = 4.0-(1.5/Motivation)-(-1.9/visual)-(-0.003/auditory)
A) Performance = 4.0+(1.5×Motivation)+(-1.9×visual)+(-0.003×auditory)
B) Performance = 4.0×(1.5×Motivation)×(-1.9×visual)×(-0.003×auditory)
C) Performance = 4.0×(1.5+Motivation)×(-1.9+visual)×(-0.003+auditory)
D) Performance = 4.0-(1.5/Motivation)-(-1.9/visual)-(-0.003/auditory)
Performance = 4.0+(1.5×Motivation)+(-1.9×visual)+(-0.003×auditory)
3
Which contrast would be most appropriate if you wished to compare each learning style against a control group (i.e. kinaesthetic)?
A) Simple
B) Repeated
C) Deviation
D) Difference
A) Simple
B) Repeated
C) Deviation
D) Difference
Simple
4
Eta squared is a measure of effect size, but how is it also expressed?
A) r2*
B) SD2
C) y2
D) x2
A) r2*
B) SD2
C) y2
D) x2
فتح الحزمة
افتح القفل للوصول البطاقات البالغ عددها 22 في هذه المجموعة.
فتح الحزمة
k this deck
5
Based on the result in Q11, which of the statements best reflects the outcome of the one-way ANOVA?
A) The means of the three groups were not significantly different.
B) The means of the three groups were significantly different.
C) The mean of the kinaesthetic group was significantly different from the visual and auditory groups.
D) The result was clear.
A) The means of the three groups were not significantly different.
B) The means of the three groups were significantly different.
C) The mean of the kinaesthetic group was significantly different from the visual and auditory groups.
D) The result was clear.
فتح الحزمة
افتح القفل للوصول البطاقات البالغ عددها 22 في هذه المجموعة.
فتح الحزمة
k this deck
6
What graphical illustration might you use to visually inspect the homogeneity of regression slopes (i.e. different variables)?
A) Scatterplot
B) Histogram
C) Box-whisker plot
D) Bar chart
A) Scatterplot
B) Histogram
C) Box-whisker plot
D) Bar chart
فتح الحزمة
افتح القفل للوصول البطاقات البالغ عددها 22 في هذه المجموعة.
فتح الحزمة
k this deck
7
If you were to analyse the effect of caffeine dose (no caffeine, high and low doses) on reaction time, which of the following might be considered the most reasonable covariate?
A) Motivation
B) Team cohesion
C) Intelligence
D) Aerobic capacity
A) Motivation
B) Team cohesion
C) Intelligence
D) Aerobic capacity
فتح الحزمة
افتح القفل للوصول البطاقات البالغ عددها 22 في هذه المجموعة.
فتح الحزمة
k this deck
8
How is eta squared calculated?
A) SSM / SST
B) SSR / SSM
C) SSM × SSR
D) SST × SSR
A) SSM / SST
B) SSR / SSM
C) SSM × SSR
D) SST × SSR
فتح الحزمة
افتح القفل للوصول البطاقات البالغ عددها 22 في هذه المجموعة.
فتح الحزمة
k this deck
9
When conducting an ANCOVA, which would be the most appropriate order?
A) Explore the data, correct outliers, check independence of treatment variable and covariate, run ANCOVA.
B) Explore the data, check independence of treatment variable and covariate, run ANCOVA, correct outliers.
C) Check independence of treatment variable and covariate, explore the data, correct outliers, run ANCOVA.
D) Correct outliers, check independence of treatment variable and covariate, explore the data, run ANCOVA.
فتح الحزمة
افتح القفل للوصول البطاقات البالغ عددها 22 في هذه المجموعة.
فتح الحزمة
k this deck
10
Calculate the mean and standard deviation of the kinaesthetic group from the data below.
A) 13(5)
B) 12(4)
C) 11(5)
D) 10(4)
A) 13(5)
B) 12(4)
C) 11(5)
D) 10(4)
فتح الحزمة
افتح القفل للوصول البطاقات البالغ عددها 22 في هذه المجموعة.
فتح الحزمة
k this deck
11
Examine the table in Q21 again and calculate the partial eta squared value for motivation.
A) .74
B) .84
C) .64
D) .54
A) .74
B) .84
C) .64
D) .54
فتح الحزمة
افتح القفل للوصول البطاقات البالغ عددها 22 في هذه المجموعة.
فتح الحزمة
k this deck
12
Run a one-way ANOVA on the covariate data to see if the means are roughly the same across the three groups. Which of the following is correct?
A) F(2, 42) = 1.6, p = .223
B) F(2, 44) = 19.9, p = 1.6
C) F(2, 42) = 268.4, p = 288.3
D) F(2, 44) = 0.223, p = 19.9
A) F(2, 42) = 1.6, p = .223
B) F(2, 44) = 19.9, p = 1.6
C) F(2, 42) = 268.4, p = 288.3
D) F(2, 44) = 0.223, p = 19.9
فتح الحزمة
افتح القفل للوصول البطاقات البالغ عددها 22 في هذه المجموعة.
فتح الحزمة
k this deck
13
Which of the following statements best describes a covariate?
A) A variable that influences an outcome variable but is not part of the experimental design
B) An independent variable that has no influence over a specific outcome variable
C) An independent variable that is used to influence a given outcome variable
D) A variable that forms part of the experimental design and which has a direct influence over a specific outcome variable
فتح الحزمة
افتح القفل للوصول البطاقات البالغ عددها 22 في هذه المجموعة.
فتح الحزمة
k this deck
14
Analyse the following data. What is the proportion of variance accounted for by the learning style alone?
A) 4%
B) 5%
C) 40%
D) 50%
A) 4%
B) 5%
C) 40%
D) 50%
فتح الحزمة
افتح القفل للوصول البطاقات البالغ عددها 22 في هذه المجموعة.
فتح الحزمة
k this deck
15
Because the research design is slightly more complicated, partial eta squared can be used. What is the correction expression for the calculation?
A) SSM / (SSM + SSR)
B) SSM × (SSM + SST)
C) SSM × (SSM / SST)
D) SSM / (SSM / SST)
A) SSM / (SSM + SSR)
B) SSM × (SSM + SST)
C) SSM × (SSM / SST)
D) SSM / (SSM / SST)
فتح الحزمة
افتح القفل للوصول البطاقات البالغ عددها 22 في هذه المجموعة.
فتح الحزمة
k this deck
16
What is the purpose of using an ANCOVA?
A) Examining the effect a treatment or experimental variable has on an outcome variable, whilst isolating the effects of a different variable which may also have an effect on the outcome variable.
B) Examining the effect an outcome variable has on an experimental or treatment variable, whilst isolating the effects of a different variable which may also have an effect on the outcome variable.
C) Examining the effect an independent variable has on a treatment or experimental variable, whilst isolating the effects of the outcome variable.
D) Examining the effect an independent variable has on an outcome variable, whilst isolating the effects of the experimental or treatment variable.
فتح الحزمة
افتح القفل للوصول البطاقات البالغ عددها 22 في هذه المجموعة.
فتح الحزمة
k this deck
17
Examine the table below. Based on the answer in Q20, calculate the partial eta squared for motivation.
A) .14
B) .74
C) .24
D) .44
A) .14
B) .74
C) .24
D) .44
فتح الحزمة
افتح القفل للوصول البطاقات البالغ عددها 22 في هذه المجموعة.
فتح الحزمة
k this deck
18
Run an ANCOVA on the data. What effect do the independent variable (i.e. learning style) and covariate (i.e. motivation) have on the dependent variable (i.e. performance)?
A) Participant motivation and learning style were both statistically significantly predictors of performance.
B) Participant motivation and learning style were not statistically significantly predictors of performance.
C) Participant motivation was statistically significant at predicting performance, but learning style was not.
D) Learning style was statistically significant at predicting performance, but participant motivation was not.
فتح الحزمة
افتح القفل للوصول البطاقات البالغ عددها 22 في هذه المجموعة.
فتح الحزمة
k this deck
19
Analyse the following illustration. Which scenario is referable when trying to explain the impact a covariate has on an outcome variable?
A) A
B) B
C) C
D) None of the scenarios are appropriate.
A) A
B) B
C) C
D) None of the scenarios are appropriate.
فتح الحزمة
افتح القفل للوصول البطاقات البالغ عددها 22 في هذه المجموعة.
فتح الحزمة
k this deck
20
Analyse the following graph. The data shows the results of three groups of 15 athletes who were instructed to complete a basketball shooting exercise (success rate from 20 free throw shots) having received one of three methods of instruction, auditory (shooting technique being verbally described by a coach), visual (shooting technique being verbally described by a coach) or kinaesthetic (no coaching, just asked to perform the shooting exercise). Motivation acted as the covariate of interest. How would you describe the regression slopes?
A) Positive and homogeneous
B) Positive and heterogeneous
C) Negative and homogeneous
D) Negative and heterogeneous
A) Positive and homogeneous
B) Positive and heterogeneous
C) Negative and homogeneous
D) Negative and heterogeneous
فتح الحزمة
افتح القفل للوصول البطاقات البالغ عددها 22 في هذه المجموعة.
فتح الحزمة
k this deck
21
How would you express the results of the learning style component of the ANCOVA?
A) F(2, 41) = 3.39, p = .04, = .14
B) F(2, 45) = 39.2, p = .04, = .24
C) F(1, 45) = 3.39, p = .00, = .74
D) F(2, 41) = 39.2, p = .04, = .44
A) F(2, 41) = 3.39, p = .04,
= .14B) F(2, 45) = 39.2, p = .04,
= .24C) F(1, 45) = 3.39, p = .00,
= .74D) F(2, 41) = 39.2, p = .04,
= .44 فتح الحزمة
افتح القفل للوصول البطاقات البالغ عددها 22 في هذه المجموعة.
فتح الحزمة
k this deck
22
How would you express the results of the motivation component of the ANCOVA?
A) F(1, 41) = 116.8, p < .001, = .74
B) F(1, 45) = 3.3, p = .043, = .84
C) F(1, 41) = 13, p = .001, = .64
D) F(1, 45) = 39.2, p < .001, = .54
A) F(1, 41) = 116.8, p < .001,
= .74B) F(1, 45) = 3.3, p = .043,
= .84C) F(1, 41) = 13, p = .001,
= .64D) F(1, 45) = 39.2, p < .001,
= .54 فتح الحزمة
افتح القفل للوصول البطاقات البالغ عددها 22 في هذه المجموعة.
فتح الحزمة
k this deck
فتح الحزمة
افتح القفل للوصول البطاقات البالغ عددها 22 في هذه المجموعة.


