Deck 6: Powerpoint 2013 : Enhancing Charts
ملء الشاشة (f)
سؤال
سؤال
سؤال
سؤال
سؤال

In the accompanying figure,number 1 is pointing to the horizontal axis title.
سؤال
In the accompanying figure,number 3 is pointing to an error bar.
سؤال
In the accompanying figure,number 2 is pointing to an error bar.
سؤال
سؤال
سؤال
سؤال
سؤال
سؤال
سؤال
سؤال
سؤال
سؤال
سؤال
سؤال
سؤال
سؤال
سؤال
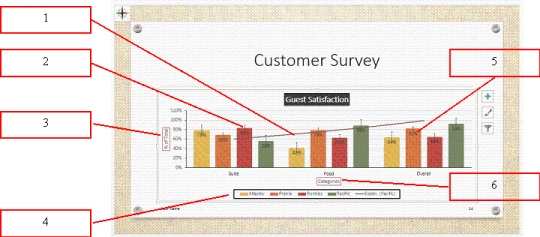
In the accompanying figure,number 4 is pointing to a(n)____________________.
سؤال
سؤال
سؤال
سؤال
سؤال
سؤال
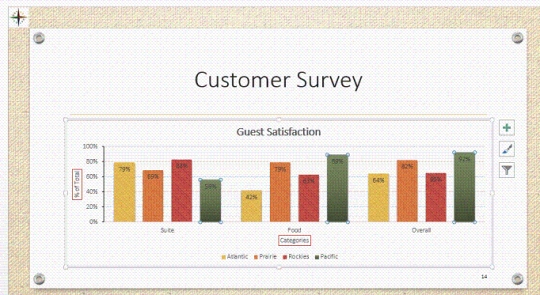
The chart in the accompanying figure has ____ series for each category.
A) 1
B) 2
C) 3
D) 4
سؤال
سؤال
سؤال
سؤال
The chart in the accompanying figure has ____ categories.
A) 1
B) 2
C) 3
D) 4
سؤال
سؤال
سؤال
سؤال
سؤال
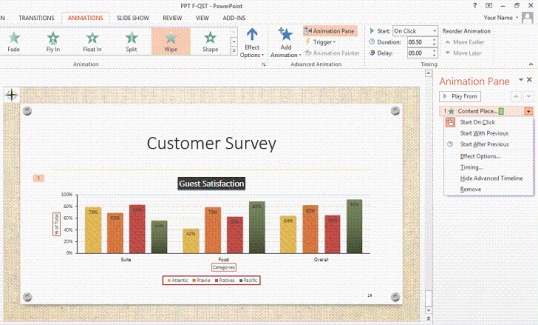
In the accompanying figure,the small pink #1 to the left of the chart indicates that the chart is ____.
A) filled with a gradient
B) a linked
C) animated
D) embedded
سؤال
سؤال
سؤال
سؤال
سؤال
In the accompanying figure,number 2 points to a(n)____________________.
سؤال
سؤال
سؤال
سؤال
سؤال
سؤال
سؤال
سؤال
سؤال
سؤال

فتح الحزمة
قم بالتسجيل لفتح البطاقات في هذه المجموعة!
Unlock Deck
Unlock Deck
1/52
العب
ملء الشاشة (f)
Deck 6: Powerpoint 2013 : Enhancing Charts
1
The object you create with a source program is called the destination file.
False
2
Excel charts can be embedded or linked in PowerPoint.
True
3
The Chart Styles button provides chart styles and color themes you can apply to charts.
True
4
A linked object is stored in its source file.
فتح الحزمة
افتح القفل للوصول البطاقات البالغ عددها 52 في هذه المجموعة.
فتح الحزمة
k this deck
5
In the accompanying figure,number 1 is pointing to the horizontal axis title.
فتح الحزمة
افتح القفل للوصول البطاقات البالغ عددها 52 في هذه المجموعة.
فتح الحزمة
k this deck
6
In the accompanying figure,number 3 is pointing to an error bar.
فتح الحزمة
افتح القفل للوصول البطاقات البالغ عددها 52 في هذه المجموعة.
فتح الحزمة
k this deck
7
In the accompanying figure,number 2 is pointing to an error bar.
فتح الحزمة
افتح القفل للوصول البطاقات البالغ عددها 52 في هذه المجموعة.
فتح الحزمة
k this deck
8
Excel is integrated with PowerPoint.
فتح الحزمة
افتح القفل للوصول البطاقات البالغ عددها 52 في هذه المجموعة.
فتح الحزمة
k this deck
9
When a file is linked to PowerPoint and you want to edit it in its source program,PowerPoint must be closed.
فتح الحزمة
افتح القفل للوصول البطاقات البالغ عددها 52 في هذه المجموعة.
فتح الحزمة
k this deck
10
Major ____ identify major units on the axis and are usually identified by a tick mark.
A) axis
B) labels
C) borders
D) gridlines
A) axis
B) labels
C) borders
D) gridlines
فتح الحزمة
افتح القفل للوصول البطاقات البالغ عددها 52 في هذه المجموعة.
فتح الحزمة
k this deck
11
If you animate a chart's data markers as a series,the entire data series is animated as a group.
فتح الحزمة
افتح القفل للوصول البطاقات البالغ عددها 52 في هذه المجموعة.
فتح الحزمة
k this deck
12
Minor gridlines can be identified by a tick mark.
فتح الحزمة
افتح القفل للوصول البطاقات البالغ عددها 52 في هذه المجموعة.
فتح الحزمة
k this deck
13
A pie chart is designed to display data from one data series in proportion to the sum of all of the data series.
فتح الحزمة
افتح القفل للوصول البطاقات البالغ عددها 52 في هذه المجموعة.
فتح الحزمة
k this deck
14
____ are small lines of measurement that intersect an axis and identify the categories,values,or series in a chart.
A) Error bars
B) Trendlines
C) Tick marks
D) Axis lines
A) Error bars
B) Trendlines
C) Tick marks
D) Axis lines
فتح الحزمة
افتح القفل للوصول البطاقات البالغ عددها 52 في هذه المجموعة.
فتح الحزمة
k this deck
15
The Chart Styles button allows you to show or hide axes,labels,or gridlines.
فتح الحزمة
افتح القفل للوصول البطاقات البالغ عددها 52 في هذه المجموعة.
فتح الحزمة
k this deck
16
When you create an Excel chart in PowerPoint,you can perform advanced commands on Excel data in the worksheet window in PowerPoint.
فتح الحزمة
افتح القفل للوصول البطاقات البالغ عددها 52 في هذه المجموعة.
فتح الحزمة
k this deck
17
A linked chart is saved as a separate file.
فتح الحزمة
افتح القفل للوصول البطاقات البالغ عددها 52 في هذه المجموعة.
فتح الحزمة
k this deck
18
You can add tick marks in the ____ pane.
A) Title
B) Chart Options
C) Format Axis
D) Format Chart
A) Title
B) Chart Options
C) Format Axis
D) Format Chart
فتح الحزمة
افتح القفل للوصول البطاقات البالغ عددها 52 في هذه المجموعة.
فتح الحزمة
k this deck
19
Click the ____ button in the Chart Layouts group to choose a chart layout from the Layout gallery.
A) Chart Style
B) Chart Layout
C) Quick Access
D) Quick Layout
A) Chart Style
B) Chart Layout
C) Quick Access
D) Quick Layout
فتح الحزمة
افتح القفل للوصول البطاقات البالغ عددها 52 في هذه المجموعة.
فتح الحزمة
k this deck
20
The Change Chart Type button is in the ____ group.
A) Type
B) Chart
C) Style
D) Change
A) Type
B) Chart
C) Style
D) Change
فتح الحزمة
افتح القفل للوصول البطاقات البالغ عددها 52 في هذه المجموعة.
فتح الحزمة
k this deck
21
A link is a ____.
A) connection between a source file and a destination file
B) connection between an embedded object and a source file
C) picture that is pasted to a slide
D) chart created using Microsoft Graph
A) connection between a source file and a destination file
B) connection between an embedded object and a source file
C) picture that is pasted to a slide
D) chart created using Microsoft Graph
فتح الحزمة
افتح القفل للوصول البطاقات البالغ عددها 52 في هذه المجموعة.
فتح الحزمة
k this deck
22
In the accompanying figure,number 4 is pointing to a(n)____________________.
فتح الحزمة
افتح القفل للوصول البطاقات البالغ عددها 52 في هذه المجموعة.
فتح الحزمة
k this deck
23
You can enter a value from ____% to 100% in the Series Overlap text box.
A) -100
B) -10
C) 0
D) 50
A) -100
B) -10
C) 0
D) 50
فتح الحزمة
افتح القفل للوصول البطاقات البالغ عددها 52 في هذه المجموعة.
فتح الحزمة
k this deck
24
Linear Up is a type of ____ that you can apply to data series markers.
A) gradient
B) pattern
C) trendline
D) tick mark
A) gradient
B) pattern
C) trendline
D) tick mark
فتح الحزمة
افتح القفل للوصول البطاقات البالغ عددها 52 في هذه المجموعة.
فتح الحزمة
k this deck
25
The following statement is NOT true about linked objects:
A) Your PowerPoint presentation must be open to update a linked object.
B) You must have access to the linked object's source file.
C) You must have access to the linked object's source program.
D) You can open a linked object by double-clicking it.
A) Your PowerPoint presentation must be open to update a linked object.
B) You must have access to the linked object's source file.
C) You must have access to the linked object's source program.
D) You can open a linked object by double-clicking it.
فتح الحزمة
افتح القفل للوصول البطاقات البالغ عددها 52 في هذه المجموعة.
فتح الحزمة
k this deck
26
The program used to create an embedded object is called the ____ program.
A) source
B) embedded
C) destination
D) linked
A) source
B) embedded
C) destination
D) linked
فتح الحزمة
افتح القفل للوصول البطاقات البالغ عددها 52 في هذه المجموعة.
فتح الحزمة
k this deck
27
You can animate data markers of the same color individually ____.
A) by category
B) by chart
C) by group
D) by series
A) by category
B) by chart
C) by group
D) by series
فتح الحزمة
افتح القفل للوصول البطاقات البالغ عددها 52 في هذه المجموعة.
فتح الحزمة
k this deck
28
The chart in the accompanying figure has ____ series for each category.
A) 1
B) 2
C) 3
D) 4
فتح الحزمة
افتح القفل للوصول البطاقات البالغ عددها 52 في هذه المجموعة.
فتح الحزمة
k this deck
29
To edit or change a linked object,____.
A) click the object,then click the Link button on the HOME tab
B) double-click the source program
C) open the linked object's source file
D) open the Links dialog box
A) click the object,then click the Link button on the HOME tab
B) double-click the source program
C) open the linked object's source file
D) open the Links dialog box
فتح الحزمة
افتح القفل للوصول البطاقات البالغ عددها 52 في هذه المجموعة.
فتح الحزمة
k this deck
30
In the chart in the accompanying figure,Rockies is a ____.
A) data series
B) data marker
C) category
D) legend
A) data series
B) data marker
C) category
D) legend
فتح الحزمة
افتح القفل للوصول البطاقات البالغ عددها 52 في هذه المجموعة.
فتح الحزمة
k this deck
31
When adjusting the space between data series markers,a positive number ____.
A) moves the data markers up in the plot area
B) adds space between the data markers
C) moves the data markers to the left in the plot area
D) overlaps the data markers
A) moves the data markers up in the plot area
B) adds space between the data markers
C) moves the data markers to the left in the plot area
D) overlaps the data markers
فتح الحزمة
افتح القفل للوصول البطاقات البالغ عددها 52 في هذه المجموعة.
فتح الحزمة
k this deck
32
The chart in the accompanying figure has ____ categories.
A) 1
B) 2
C) 3
D) 4
فتح الحزمة
افتح القفل للوصول البطاقات البالغ عددها 52 في هذه المجموعة.
فتح الحزمة
k this deck
33
To format a linked Excel worksheet,right-click it and then click ____.
A) Format Object
B) Format Painter
C) Format Linked Object
D) Format
A) Format Object
B) Format Painter
C) Format Linked Object
D) Format
فتح الحزمة
افتح القفل للوصول البطاقات البالغ عددها 52 في هذه المجموعة.
فتح الحزمة
k this deck
34
A destination file is ____.
A) the file that is saved by a source program when creating an embedded object
B) another type of source file
C) a linked object
D) the file,such as a presentation file,where an object is embedded
A) the file that is saved by a source program when creating an embedded object
B) another type of source file
C) a linked object
D) the file,such as a presentation file,where an object is embedded
فتح الحزمة
افتح القفل للوصول البطاقات البالغ عددها 52 في هذه المجموعة.
فتح الحزمة
k this deck
35
When you change the source file of a linked object,____.
A) the linked object becomes invalid and is removed from the slide
B) a new linked object is created
C) the linked object reflects the changes made
D) access to the linked object is restricted
A) the linked object becomes invalid and is removed from the slide
B) a new linked object is created
C) the linked object reflects the changes made
D) access to the linked object is restricted
فتح الحزمة
افتح القفل للوصول البطاقات البالغ عددها 52 في هذه المجموعة.
فتح الحزمة
k this deck
36
The object you create with the source program is saved to a file called the ____ file.
A) destination
B) linked
C) source
D) fixed layout
A) destination
B) linked
C) source
D) fixed layout
فتح الحزمة
افتح القفل للوصول البطاقات البالغ عددها 52 في هذه المجموعة.
فتح الحزمة
k this deck
37
In the accompanying figure,the small pink #1 to the left of the chart indicates that the chart is ____.
A) filled with a gradient
B) a linked
C) animated
D) embedded
فتح الحزمة
افتح القفل للوصول البطاقات البالغ عددها 52 في هذه المجموعة.
فتح الحزمة
k this deck
38
To change the space between data series markers in a chart,____.
A) adjust the number in the Series Overlap text box
B) drag a data series marker left or right
C) change the width of the data series marker outline
D) modify the data series marker formula
A) adjust the number in the Series Overlap text box
B) drag a data series marker left or right
C) change the width of the data series marker outline
D) modify the data series marker formula
فتح الحزمة
افتح القفل للوصول البطاقات البالغ عددها 52 في هذه المجموعة.
فتح الحزمة
k this deck
39
Which tab is used for modifying a chart?
A) CHART TOOLS DESIGN
B) EXCEL
C) EXCEL TOOLS
D) MODIFY CHART
A) CHART TOOLS DESIGN
B) EXCEL
C) EXCEL TOOLS
D) MODIFY CHART
فتح الحزمة
افتح القفل للوصول البطاقات البالغ عددها 52 في هذه المجموعة.
فتح الحزمة
k this deck
40
Which group in PowerPoint allows you to format the chart title and axis labels?
A) Arrange
B) Shape Styles
C) Chart Styles
D) Chart Designs
A) Arrange
B) Shape Styles
C) Chart Styles
D) Chart Designs
فتح الحزمة
افتح القفل للوصول البطاقات البالغ عددها 52 في هذه المجموعة.
فتح الحزمة
k this deck
41
The object you create with a source program is saved in a(n)destination file._________________________
فتح الحزمة
افتح القفل للوصول البطاقات البالغ عددها 52 في هذه المجموعة.
فتح الحزمة
k this deck
42
In the accompanying figure,number 2 points to a(n)____________________.
فتح الحزمة
افتح القفل للوصول البطاقات البالغ عددها 52 في هذه المجموعة.
فتح الحزمة
k this deck
43
Minor gridlines are darker in color than other gridlines._________________________
فتح الحزمة
افتح القفل للوصول البطاقات البالغ عددها 52 في هذه المجموعة.
فتح الحزمة
k this deck
44
A(n)linked object is stored in its source file,not on a presentation slide like an embedded objects._________________________
فتح الحزمة
افتح القفل للوصول البطاقات البالغ عددها 52 في هذه المجموعة.
فتح الحزمة
k this deck
45
Major ____________________ identify major units on the axis and are usually identified by tick marks.
فتح الحزمة
افتح القفل للوصول البطاقات البالغ عددها 52 في هذه المجموعة.
فتح الحزمة
k this deck
46
____________________ gridlines identify minor units on the axis and are usually identified by tick marks.
فتح الحزمة
افتح القفل للوصول البطاقات البالغ عددها 52 في هذه المجموعة.
فتح الحزمة
k this deck
47
Describe in detail your understanding of embedded and linked charts.Discuss their differences and similarities and properly define the terms "source file," "destination file," and "source program."
فتح الحزمة
افتح القفل للوصول البطاقات البالغ عددها 52 في هذه المجموعة.
فتح الحزمة
k this deck
48
You can change the color and effects of chart elements by applying one of the ____________________ in the Chart Styles gallery.
فتح الحزمة
افتح القفل للوصول البطاقات البالغ عددها 52 في هذه المجموعة.
فتح الحزمة
k this deck
49
Explain how a chart is animated.Describe which parts of the chart can be animated and how the animation works.
فتح الحزمة
افتح القفل للوصول البطاقات البالغ عددها 52 في هذه المجموعة.
فتح الحزمة
k this deck
50
Exit animation effects cause an object to leave the slide._________________________
فتح الحزمة
افتح القفل للوصول البطاقات البالغ عددها 52 في هذه المجموعة.
فتح الحزمة
k this deck
51
Animating data markers individually by ____________________ displays the data markers of each series.
فتح الحزمة
افتح القفل للوصول البطاقات البالغ عددها 52 في هذه المجموعة.
فتح الحزمة
k this deck
52
Animating data markers individually by ____________________ displays the data markers of each category in the chart.
فتح الحزمة
افتح القفل للوصول البطاقات البالغ عددها 52 في هذه المجموعة.
فتح الحزمة
k this deck
فتح الحزمة
افتح القفل للوصول البطاقات البالغ عددها 52 في هذه المجموعة.


