Deck 10: Two-Sample Tests
ملء الشاشة (f)
سؤال
سؤال
Given the following information, calculate sp2, the pooled sample variance that should be used in the pooled-variance t test. 
A) sp2 = 6.00
B) sp2 = 5.00
C) sp2 = 5.23
D) sp2 = 4.00
A) sp2 = 6.00
B) sp2 = 5.00
C) sp2 = 5.23
D) sp2 = 4.00
سؤال
سؤال
سؤال
TABLE 10-1
Are Japanese managers more motivated than American managers? A randomly selected group of each were administered the Sarnoff Survey of Attitudes Toward Life (SSATL), which measures motivation for upward mobility. The SSATL scores are summarized below.

Referring to Table 10-1, what is the value of the test statistic?
A) -14.08
B) -11.8092
C) -1.9677
D) 96.4471
Are Japanese managers more motivated than American managers? A randomly selected group of each were administered the Sarnoff Survey of Attitudes Toward Life (SSATL), which measures motivation for upward mobility. The SSATL scores are summarized below.
Referring to Table 10-1, what is the value of the test statistic?
A) -14.08
B) -11.8092
C) -1.9677
D) 96.4471
سؤال
سؤال
Given the following information, calculate the degrees of freedom that should be used in the pooled-variance t test. 
A) df = 41
B) df = 39
C) df = 16
D) df = 25
A) df = 41
B) df = 39
C) df = 16
D) df = 25
سؤال
TABLE 10-1
Are Japanese managers more motivated than American managers? A randomly selected group of each were administered the Sarnoff Survey of Attitudes Toward Life (SSATL), which measures motivation for upward mobility. The SSATL scores are summarized below.
Referring to Table 10-1, judging from the way the data were collected, which test would likely be most appropriate to employ?
A) paired t test
B) pooled-variance t test for the difference between two means
C) F test for the ratio of two variances
D) Z test for the difference between two proportions
سؤال
سؤال
سؤال
سؤال
سؤال
سؤال
سؤال
سؤال
سؤال
سؤال
سؤال
سؤال
سؤال
TABLE 10-3
The use of preservatives by food processors has become a controversial issue. Suppose 2 preservatives are extensively tested and determined safe for use in meats. A processor wants to compare the preservatives for their effects on retarding spoilage. Suppose 15 cuts of fresh meat are treated with preservative I and 15 are treated with preservative II, and the number of hours until spoilage begins is recorded for each of the 30 cuts of meat. The results are summarized in the table below.

Referring to Table 10-3, suppose α = 0.05. Which of the following represents the result of the relevant hypothesis test?
A) The alternative hypothesis is rejected.
B) The null hypothesis is rejected.
C) The null hypothesis is not rejected.
D) Insufficient information exists on which to make a decision.
The use of preservatives by food processors has become a controversial issue. Suppose 2 preservatives are extensively tested and determined safe for use in meats. A processor wants to compare the preservatives for their effects on retarding spoilage. Suppose 15 cuts of fresh meat are treated with preservative I and 15 are treated with preservative II, and the number of hours until spoilage begins is recorded for each of the 30 cuts of meat. The results are summarized in the table below.
Referring to Table 10-3, suppose α = 0.05. Which of the following represents the result of the relevant hypothesis test?
A) The alternative hypothesis is rejected.
B) The null hypothesis is rejected.
C) The null hypothesis is not rejected.
D) Insufficient information exists on which to make a decision.
سؤال
TABLE 10-4
A real estate company is interested in testing whether, on average, families in Gotham have been living in their current homes for less time than families in Metropolis have. Assume that the two population variances are equal. A random sample of 100 families from Gotham and a random sample of 150 families in Metropolis yield the following data on length of residence in current homes.

Referring to Table 10-4, what is a point estimate for the mean of the sampling distribution of the difference between the 2 sample means?
A) -22
B) -10
C) -15
D) 0
A real estate company is interested in testing whether, on average, families in Gotham have been living in their current homes for less time than families in Metropolis have. Assume that the two population variances are equal. A random sample of 100 families from Gotham and a random sample of 150 families in Metropolis yield the following data on length of residence in current homes.
Referring to Table 10-4, what is a point estimate for the mean of the sampling distribution of the difference between the 2 sample means?
A) -22
B) -10
C) -15
D) 0
سؤال
TABLE 10-1
Are Japanese managers more motivated than American managers? A randomly selected group of each were administered the Sarnoff Survey of Attitudes Toward Life (SSATL), which measures motivation for upward mobility. The SSATL scores are summarized below.
Referring to Table 10-1, find the p-value if we assume that the alternative hypothesis was a two-tail test.
A) smaller than 0.01
B) between 0.01 and 0.05
C) between 0.05 and 0.1
D) greater than 0.1
سؤال
TABLE 10-4
A real estate company is interested in testing whether, on average, families in Gotham have been living in their current homes for less time than families in Metropolis have. Assume that the two population variances are equal. A random sample of 100 families from Gotham and a random sample of 150 families in Metropolis yield the following data on length of residence in current homes.
Referring to Table 10-4, what is(are) the critical value(s) of the relevant hypothesis test if the level of significance is 0.01?
A) t ≅ Z = -1.96
B) t ≅ Z = ±1.96
C) t ≅ Z = -2.080
D) t ≅ Z = -2.33
سؤال
TABLE 10-4
A real estate company is interested in testing whether, on average, families in Gotham have been living in their current homes for less time than families in Metropolis have. Assume that the two population variances are equal. A random sample of 100 families from Gotham and a random sample of 150 families in Metropolis yield the following data on length of residence in current homes.
Referring to Table 10-4, what is the estimated standard error of the difference between the 2 sample means?
A) 4.06
B) 5.61
C) 8.01
D) 16.00
سؤال
TABLE 10-4
A real estate company is interested in testing whether, on average, families in Gotham have been living in their current homes for less time than families in Metropolis have. Assume that the two population variances are equal. A random sample of 100 families from Gotham and a random sample of 150 families in Metropolis yield the following data on length of residence in current homes.
Referring to Table 10-4, which of the following represents the relevant hypotheses tested by the real estate company?
A)
B)
C)
D)
سؤال
TABLE 10-4
A real estate company is interested in testing whether, on average, families in Gotham have been living in their current homes for less time than families in Metropolis have. Assume that the two population variances are equal. A random sample of 100 families from Gotham and a random sample of 150 families in Metropolis yield the following data on length of residence in current homes.
Referring to Table 10-4, what is(are) the critical value(s) of the relevant hypothesis test if the level of significance is 0.05?
A) t ≅ Z = -1.645
B) t ≅ Z = ±1.96
C) t ≅ Z = -1.96
D) t ≅ Z = -2.080
سؤال
TABLE 10-3
The use of preservatives by food processors has become a controversial issue. Suppose 2 preservatives are extensively tested and determined safe for use in meats. A processor wants to compare the preservatives for their effects on retarding spoilage. Suppose 15 cuts of fresh meat are treated with preservative I and 15 are treated with preservative II, and the number of hours until spoilage begins is recorded for each of the 30 cuts of meat. The results are summarized in the table below.
Referring to Table 10-3, what is the value of the test statistic for testing if the population variances differ for preservatives I and II?
سؤال
TABLE 10-2
A researcher randomly sampled 30 graduates of an MBA program and recorded data concerning their starting salaries. Of primary interest to the researcher was the effect of gender on starting salaries. Analysis of the mean salaries of the females and males in the sample is given below.
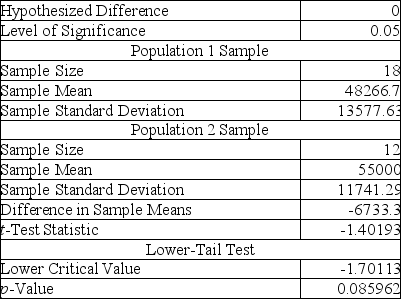
Referring to Table 10-2, the researcher was attempting to show statistically that the female MBA graduates have a significantly lower mean starting salary than the male MBA graduates. From the analysis in Table 10-2, the correct test statistic is:
A) 0.0860
B) -1.4019
C) -1.7011
D) -6,733.33
A researcher randomly sampled 30 graduates of an MBA program and recorded data concerning their starting salaries. Of primary interest to the researcher was the effect of gender on starting salaries. Analysis of the mean salaries of the females and males in the sample is given below.
Referring to Table 10-2, the researcher was attempting to show statistically that the female MBA graduates have a significantly lower mean starting salary than the male MBA graduates. From the analysis in Table 10-2, the correct test statistic is:
A) 0.0860
B) -1.4019
C) -1.7011
D) -6,733.33
سؤال
TABLE 10-2
A researcher randomly sampled 30 graduates of an MBA program and recorded data concerning their starting salaries. Of primary interest to the researcher was the effect of gender on starting salaries. Analysis of the mean salaries of the females and males in the sample is given below.
Referring to Table 10-2, the researcher was attempting to show statistically that the female MBA graduates have a significantly lower mean starting salary than the male MBA graduates. According to the test run, which of the following is an appropriate alternative hypothesis?
A) H1 : μfemales > μmales
B) H1 : μfemales < μmales
C) H1 : μfemales ≠ μmales
D) H1 : μfemales = μmales
سؤال
TABLE 10-3
The use of preservatives by food processors has become a controversial issue. Suppose 2 preservatives are extensively tested and determined safe for use in meats. A processor wants to compare the preservatives for their effects on retarding spoilage. Suppose 15 cuts of fresh meat are treated with preservative I and 15 are treated with preservative II, and the number of hours until spoilage begins is recorded for each of the 30 cuts of meat. The results are summarized in the table below.
Referring to Table 10-3,
A) There is no evidence of a difference in the population variances between preservatives I and II.
B) There is evidence of a difference in the population variances between preservatives I and II.
C) There is no evidence that the population variances between preservatives I and II are the same.
D) There is evidence that the population variances between preservatives I and II are the same.
سؤال
TABLE 10-3
The use of preservatives by food processors has become a controversial issue. Suppose 2 preservatives are extensively tested and determined safe for use in meats. A processor wants to compare the preservatives for their effects on retarding spoilage. Suppose 15 cuts of fresh meat are treated with preservative I and 15 are treated with preservative II, and the number of hours until spoilage begins is recorded for each of the 30 cuts of meat. The results are summarized in the table below.
Referring to Table 10-3, state the null and alternative hypotheses for testing if the population variances differ for preservatives I and II.
A)
B)
C)
D)
سؤال
TABLE 10-2
A researcher randomly sampled 30 graduates of an MBA program and recorded data concerning their starting salaries. Of primary interest to the researcher was the effect of gender on starting salaries. Analysis of the mean salaries of the females and males in the sample is given below.
Referring to Table 10-2, what is the 90% confidence interval estimate for the difference between two means?
سؤال
TABLE 10-3
The use of preservatives by food processors has become a controversial issue. Suppose 2 preservatives are extensively tested and determined safe for use in meats. A processor wants to compare the preservatives for their effects on retarding spoilage. Suppose 15 cuts of fresh meat are treated with preservative I and 15 are treated with preservative II, and the number of hours until spoilage begins is recorded for each of the 30 cuts of meat. The results are summarized in the table below.
Referring to Table 10-3, what is the largest level of significance at which a test if the population variances differ for preservatives I and II will not be rejected?
سؤال
TABLE 10-2
A researcher randomly sampled 30 graduates of an MBA program and recorded data concerning their starting salaries. Of primary interest to the researcher was the effect of gender on starting salaries. Analysis of the mean salaries of the females and males in the sample is given below.
Referring to Table 10-2, the researcher was attempting to show statistically that the female MBA graduates have a significantly lower mean starting salary than the male MBA graduates. The proper conclusion for this test is:
A) At the α = 0.10 level, there is sufficient evidence to indicate a difference in the mean starting salaries of male and female MBA graduates.
B) At the α = 0.10 level, there is sufficient evidence to indicate that females have a lower mean starting salary than male MBA graduates.
C) At the α = 0.10 level, there is sufficient evidence to indicate that females have a higher mean starting salary than male MBA graduates.
D) At the α = 0.10 level, there is insufficient evidence to indicate any difference in the mean starting salaries of male and female MBA graduates.
سؤال
TABLE 10-2
A researcher randomly sampled 30 graduates of an MBA program and recorded data concerning their starting salaries. Of primary interest to the researcher was the effect of gender on starting salaries. Analysis of the mean salaries of the females and males in the sample is given below.
Referring to Table 10-2, what is the 99% confidence interval estimate for the difference between two means?
سؤال
TABLE 10-3
The use of preservatives by food processors has become a controversial issue. Suppose 2 preservatives are extensively tested and determined safe for use in meats. A processor wants to compare the preservatives for their effects on retarding spoilage. Suppose 15 cuts of fresh meat are treated with preservative I and 15 are treated with preservative II, and the number of hours until spoilage begins is recorded for each of the 30 cuts of meat. The results are summarized in the table below.
Referring to Table 10-3, what is the critical value for testing if the population variances differ for preservatives I and II at the 5% level of significance?
سؤال
TABLE 10-2
A researcher randomly sampled 30 graduates of an MBA program and recorded data concerning their starting salaries. Of primary interest to the researcher was the effect of gender on starting salaries. Analysis of the mean salaries of the females and males in the sample is given below.
Referring to Table 10-2, what is the 95% confidence interval estimate for the difference between two means?
سؤال
TABLE 10-3
The use of preservatives by food processors has become a controversial issue. Suppose 2 preservatives are extensively tested and determined safe for use in meats. A processor wants to compare the preservatives for their effects on retarding spoilage. Suppose 15 cuts of fresh meat are treated with preservative I and 15 are treated with preservative II, and the number of hours until spoilage begins is recorded for each of the 30 cuts of meat. The results are summarized in the table below.
Referring to Table 10-3, what assumptions are necessary for testing if the population variances differ for preservatives I and II?
A) Both sampled populations are normally distributed.
B) Both samples are random and independent.
C) Neither A nor B is necessary.
D) Both A and B are necessary.
سؤال
TABLE 10-2
A researcher randomly sampled 30 graduates of an MBA program and recorded data concerning their starting salaries. Of primary interest to the researcher was the effect of gender on starting salaries. Analysis of the mean salaries of the females and males in the sample is given below.
Referring to Table 10-2, the researcher was attempting to show statistically that the female MBA graduates have a significantly lower mean starting salary than the male MBA graduates. What assumptions were necessary to conduct this hypothesis test?
A) Both populations of salaries (male and female) must have approximate normal distributions.
B) The population variances are approximately equal.
C) The samples were randomly and independently selected.
D) All of the above assumptions were necessary.
سؤال
TABLE 10-5
To test the effectiveness of a business school preparation course, 8 students took a general business test before and after the course. The results are given below.

Referring to Table 10-5, one must assume that the population of difference scores is normally distributed.
To test the effectiveness of a business school preparation course, 8 students took a general business test before and after the course. The results are given below.
Referring to Table 10-5, one must assume that the population of difference scores is normally distributed.
سؤال
سؤال
TABLE 10-4
A real estate company is interested in testing whether, on average, families in Gotham have been living in their current homes for less time than families in Metropolis have. Assume that the two population variances are equal. A random sample of 100 families from Gotham and a random sample of 150 families in Metropolis yield the following data on length of residence in current homes.
Referring to Table 10-4, suppose α = 0.10. Which of the following represents the correct conclusion?
A) There is not enough evidence that the mean amount of time families in Gotham have been living in their current homes is less than families in Metropolis.
B) There is enough evidence that the mean amount of time families in Gotham have been living in their current homes is less than families in Metropolis.
C) There is not enough evidence that the mean amount of time families in Gotham have been living in their current homes is not less than families in Metropolis.
D) There is enough evidence that the mean amount of time families in Gotham have been living in their current homes is not less than families in Metropolis.
سؤال
TABLE 10-4
A real estate company is interested in testing whether, on average, families in Gotham have been living in their current homes for less time than families in Metropolis have. Assume that the two population variances are equal. A random sample of 100 families from Gotham and a random sample of 150 families in Metropolis yield the following data on length of residence in current homes.
Referring to Table 10-4, what is the 95% confidence interval estimate for the difference in the two means?
سؤال
TABLE 10-4
A real estate company is interested in testing whether, on average, families in Gotham have been living in their current homes for less time than families in Metropolis have. Assume that the two population variances are equal. A random sample of 100 families from Gotham and a random sample of 150 families in Metropolis yield the following data on length of residence in current homes.
Referring to Table 10-4, what is the standardized value of the estimate of the mean of the sampling distribution of the difference between sample means?
A) -8.75
B) -3.69
C) -2.33
D) -1.96
سؤال
TABLE 10-4
A real estate company is interested in testing whether, on average, families in Gotham have been living in their current homes for less time than families in Metropolis have. Assume that the two population variances are equal. A random sample of 100 families from Gotham and a random sample of 150 families in Metropolis yield the following data on length of residence in current homes.
Referring to Table 10-4, what is the 99% confidence interval estimate for the difference in the two means?
سؤال
TABLE 10-4
A real estate company is interested in testing whether, on average, families in Gotham have been living in their current homes for less time than families in Metropolis have. Assume that the two population variances are equal. A random sample of 100 families from Gotham and a random sample of 150 families in Metropolis yield the following data on length of residence in current homes.
Referring to Table 10-4, suppose α = 0.10. Which of the following represents the result of the relevant hypothesis test?
A) The alternative hypothesis is rejected.
B) The null hypothesis is rejected.
C) The null hypothesis is not rejected.
D) Insufficient information exists on which to make a decision.
سؤال
TABLE 10-4
A real estate company is interested in testing whether, on average, families in Gotham have been living in their current homes for less time than families in Metropolis have. Assume that the two population variances are equal. A random sample of 100 families from Gotham and a random sample of 150 families in Metropolis yield the following data on length of residence in current homes.
Referring to Table 10-4, suppose α = 0.05. Which of the following represents the result of the relevant hypothesis test?
A) The alternative hypothesis is rejected.
B) The null hypothesis is rejected.
C) The null hypothesis is not rejected.
D) Insufficient information exists on which to make a decision.
سؤال
TABLE 10-5
To test the effectiveness of a business school preparation course, 8 students took a general business test before and after the course. The results are given below.
Referring to Table 10-5, at the 0.05 level of significance, the decision for this hypothesis test would be:
A) reject the null hypothesis.
B) do not reject the null hypothesis.
C) reject the alternative hypothesis.
D) It cannot be determined from the information given.
سؤال
TABLE 10-5
To test the effectiveness of a business school preparation course, 8 students took a general business test before and after the course. The results are given below.
Referring to Table 10-5, the p-value of the test statistic is ________.
To test the effectiveness of a business school preparation course, 8 students took a general business test before and after the course. The results are given below.
Referring to Table 10-5, the p-value of the test statistic is ________.
سؤال
TABLE 10-5
To test the effectiveness of a business school preparation course, 8 students took a general business test before and after the course. The results are given below.
Referring to Table 10-5, what is the critical value for testing at the 5% level of significance whether the business school preparation course is effective in improving exam scores?
A) 2.365
B) 2.145
C) 1.761
D) 1.895
سؤال
TABLE 10-5
To test the effectiveness of a business school preparation course, 8 students took a general business test before and after the course. The results are given below.
Referring to Table 10-5, in examining the differences between related samples we are essentially sampling from an underlying population of difference "scores."
سؤال
TABLE 10-4
A real estate company is interested in testing whether, on average, families in Gotham have been living in their current homes for less time than families in Metropolis have. Assume that the two population variances are equal. A random sample of 100 families from Gotham and a random sample of 150 families in Metropolis yield the following data on length of residence in current homes.
Referring to Table 10-4, suppose α = 0.01. Which of the following represents the result of the relevant hypothesis test?
A) The alternative hypothesis is rejected.
B) The null hypothesis is rejected.
C) The null hypothesis is not rejected.
D) Insufficient information exists on which to make a decision.
سؤال
TABLE 10-4
A real estate company is interested in testing whether, on average, families in Gotham have been living in their current homes for less time than families in Metropolis have. Assume that the two population variances are equal. A random sample of 100 families from Gotham and a random sample of 150 families in Metropolis yield the following data on length of residence in current homes.
Referring to Table 10-4, suppose α = 0.05. Which of the following represents the correct conclusion?
A) There is not enough evidence that the mean amount of time families in Gotham have been living in their current homes is less than families in Metropolis.
B) There is enough evidence that the mean amount of time families in Gotham have been living in their current homes is less than families in Metropolis.
C) There is not enough evidence that the mean amount of time families in Gotham have been living in their current homes is not less than families in Metropolis.
D) There is enough evidence that the mean amount of time families in Gotham have been living in their current homes is not less than families in Metropolis.
سؤال
TABLE 10-4
A real estate company is interested in testing whether, on average, families in Gotham have been living in their current homes for less time than families in Metropolis have. Assume that the two population variances are equal. A random sample of 100 families from Gotham and a random sample of 150 families in Metropolis yield the following data on length of residence in current homes.
Referring to Table 10-4, suppose α = 0.01. Which of the following represents the correct conclusion?
A) There is not enough evidence that the mean amount of time families in Gotham have been living in their current homes is less than families in Metropolis.
B) There is enough evidence that the mean amount of time families in Gotham have been living in their current homes is less than families in Metropolis.
C) There is not enough evidence that the mean amount of time families in Gotham have been living in their current homes is not less than families in Metropolis.
D) There is enough evidence that the mean amount of time families in Gotham have been living in their current homes is not less than families in Metropolis.
سؤال
TABLE 10-5
To test the effectiveness of a business school preparation course, 8 students took a general business test before and after the course. The results are given below.
Referring to Table 10-5, the number of degrees of freedom is
A) 14.
B) 13.
C) 8.
D) 7.
To test the effectiveness of a business school preparation course, 8 students took a general business test before and after the course. The results are given below.
Referring to Table 10-5, the number of degrees of freedom is
A) 14.
B) 13.
C) 8.
D) 7.
سؤال
TABLE 10-5
To test the effectiveness of a business school preparation course, 8 students took a general business test before and after the course. The results are given below.
Referring to Table 10-5, the value of the standard error of the difference scores is
A) 65.027.
B) 60.828.
C) 22.991.
D) 14.696.
To test the effectiveness of a business school preparation course, 8 students took a general business test before and after the course. The results are given below.
Referring to Table 10-5, the value of the standard error of the difference scores is
A) 65.027.
B) 60.828.
C) 22.991.
D) 14.696.
سؤال
TABLE 10-5
To test the effectiveness of a business school preparation course, 8 students took a general business test before and after the course. The results are given below.
Referring to Table 10-5, the value of the sample mean difference is ________ if the difference scores reflect the results of the exam after the course minus the results of the exam before the course.
A) 0
B) 50
C) 68
D) 400
سؤال
TABLE 10-5
To test the effectiveness of a business school preparation course, 8 students took a general business test before and after the course. The results are given below.
Referring to Table 10-5, the calculated value of the test statistic is ________.
To test the effectiveness of a business school preparation course, 8 students took a general business test before and after the course. The results are given below.
Referring to Table 10-5, the calculated value of the test statistic is ________.
سؤال
TABLE 10-5
To test the effectiveness of a business school preparation course, 8 students took a general business test before and after the course. The results are given below.
Referring to Table 10-5, at the 0.05 level of significance, the conclusion for this hypothesis test would be:
A) the business school preparation course does improve exam score.
B) the business school preparation course does not improve exam score.
C) the business school preparation course has no impact on exam score.
D) No conclusion can be drawn from the information given.
سؤال
سؤال
سؤال
سؤال
سؤال
سؤال
سؤال
سؤال
سؤال
سؤال
سؤال
سؤال
سؤال
سؤال
سؤال
سؤال
سؤال
سؤال
سؤال
سؤال

فتح الحزمة
قم بالتسجيل لفتح البطاقات في هذه المجموعة!
Unlock Deck
Unlock Deck
1/190
العب
ملء الشاشة (f)
Deck 10: Two-Sample Tests
1
In testing for the differences between the means of two related populations, the ________ hypothesis is the hypothesis of "no differences."
null or HO
2
Given the following information, calculate sp2, the pooled sample variance that should be used in the pooled-variance t test.
A) sp2 = 6.00
B) sp2 = 5.00
C) sp2 = 5.23
D) sp2 = 4.00
A) sp2 = 6.00
B) sp2 = 5.00
C) sp2 = 5.23
D) sp2 = 4.00
sp2 = 5.23
3
In testing for differences between the means of 2 related populations where the variance of the differences is unknown, the degrees of freedom are
A) n - 1.
B) n1 + n2 - 1.
C) n1 + n2 - 2.
D) n - 2.
A) n - 1.
B) n1 + n2 - 1.
C) n1 + n2 - 2.
D) n - 2.
n - 1.
4
In testing for the differences between the means of 2 independent populations where the variances in each population are unknown but assumed equal, the degrees of freedom are
A) n - 1.
B) n1 + n2 - 1.
C) n1 + n2 - 2.
D) n - 2.
A) n - 1.
B) n1 + n2 - 1.
C) n1 + n2 - 2.
D) n - 2.
فتح الحزمة
افتح القفل للوصول البطاقات البالغ عددها 190 في هذه المجموعة.
فتح الحزمة
k this deck
5
TABLE 10-1
Are Japanese managers more motivated than American managers? A randomly selected group of each were administered the Sarnoff Survey of Attitudes Toward Life (SSATL), which measures motivation for upward mobility. The SSATL scores are summarized below.
Referring to Table 10-1, what is the value of the test statistic?
A) -14.08
B) -11.8092
C) -1.9677
D) 96.4471
فتح الحزمة
افتح القفل للوصول البطاقات البالغ عددها 190 في هذه المجموعة.
فتح الحزمة
k this deck
6
When testing for the difference between 2 population variances with sample sizes of n1 = 8 and n2 = 10, where n1 has the larger variance, the number of degrees of freedom are
A) 8 and 10.
B) 7 and 9.
C) 18.
D) 16.
A) 8 and 10.
B) 7 and 9.
C) 18.
D) 16.
فتح الحزمة
افتح القفل للوصول البطاقات البالغ عددها 190 في هذه المجموعة.
فتح الحزمة
k this deck
7
Given the following information, calculate the degrees of freedom that should be used in the pooled-variance t test.
A) df = 41
B) df = 39
C) df = 16
D) df = 25
A) df = 41
B) df = 39
C) df = 16
D) df = 25
فتح الحزمة
افتح القفل للوصول البطاقات البالغ عددها 190 في هذه المجموعة.
فتح الحزمة
k this deck
8
TABLE 10-1
Are Japanese managers more motivated than American managers? A randomly selected group of each were administered the Sarnoff Survey of Attitudes Toward Life (SSATL), which measures motivation for upward mobility. The SSATL scores are summarized below.
Referring to Table 10-1, judging from the way the data were collected, which test would likely be most appropriate to employ?
A) paired t test
B) pooled-variance t test for the difference between two means
C) F test for the ratio of two variances
D) Z test for the difference between two proportions
فتح الحزمة
افتح القفل للوصول البطاقات البالغ عددها 190 في هذه المجموعة.
فتح الحزمة
k this deck
9
In testing for the differences between the means of two related populations, we assume that the differences follow a ________ distribution.
فتح الحزمة
افتح القفل للوصول البطاقات البالغ عددها 190 في هذه المجموعة.
فتح الحزمة
k this deck
10
The statistical distribution used for testing the difference between two population variances is the ________ distribution.
A) t
B) standardized normal
C) binomial
D) F
A) t
B) standardized normal
C) binomial
D) F
فتح الحزمة
افتح القفل للوصول البطاقات البالغ عددها 190 في هذه المجموعة.
فتح الحزمة
k this deck
11
The t test for the mean difference between 2 related populations assumes that the
A) population sizes are equal.
B) sample variances are equal.
C) population of differences is approximately normal or sample sizes are large enough.
D) All of the above.
A) population sizes are equal.
B) sample variances are equal.
C) population of differences is approximately normal or sample sizes are large enough.
D) All of the above.
فتح الحزمة
افتح القفل للوصول البطاقات البالغ عددها 190 في هذه المجموعة.
فتح الحزمة
k this deck
12
In testing for the differences between the means of two independent populations, we assume that the 2 populations each follow a ________ distribution.
فتح الحزمة
افتح القفل للوصول البطاقات البالغ عددها 190 في هذه المجموعة.
فتح الحزمة
k this deck
13
In testing for differences between the means of two independent populations, the null hypothesis is:
A) H0 : μ1 - μ2 = 2.
B) H0 : μ1 - μ2 = 0.
C) H0 : μ1 - μ2 > 0.
D) H0 : μ1 - μ2 < 2.
A) H0 : μ1 - μ2 = 2.
B) H0 : μ1 - μ2 = 0.
C) H0 : μ1 - μ2 > 0.
D) H0 : μ1 - μ2 < 2.
فتح الحزمة
افتح القفل للوصول البطاقات البالغ عددها 190 في هذه المجموعة.
فتح الحزمة
k this deck
14
The test for the equality of two population variances is based on
A) the difference between the 2 sample variances.
B) the ratio of the 2 sample variances.
C) the difference between the 2 population variances.
D) the difference between the sample variances divided by the difference between the sample means.
A) the difference between the 2 sample variances.
B) the ratio of the 2 sample variances.
C) the difference between the 2 population variances.
D) the difference between the sample variances divided by the difference between the sample means.
فتح الحزمة
افتح القفل للوصول البطاقات البالغ عددها 190 في هذه المجموعة.
فتح الحزمة
k this deck
15
The t test for the difference between the means of 2 independent populations assumes that the respective
A) sample sizes are equal.
B) sample variances are equal.
C) populations are approximately normal.
D) All of the above.
A) sample sizes are equal.
B) sample variances are equal.
C) populations are approximately normal.
D) All of the above.
فتح الحزمة
افتح القفل للوصول البطاقات البالغ عددها 190 في هذه المجموعة.
فتح الحزمة
k this deck
16
The F test used for testing the difference in two population variances is always a one-tail test.
فتح الحزمة
افتح القفل للوصول البطاقات البالغ عددها 190 في هذه المجموعة.
فتح الحزمة
k this deck
17
If we are testing for the difference between the means of 2 independent populations presumes equal variances with samples of n1 = 20 and n2 = 20, the number of degrees of freedom is equal to
A) 39.
B) 38.
C) 19.
D) 18.
A) 39.
B) 38.
C) 19.
D) 18.
فتح الحزمة
افتح القفل للوصول البطاقات البالغ عددها 190 في هذه المجموعة.
فتح الحزمة
k this deck
18
In what type of test is the variable of interest the difference between the values of the observations rather than the observations themselves?
A) A test for the equality of variances from 2 independent populations.
B) A test for the difference between the means of 2 related populations.
C) A test for the difference between the means of 2 independent populations.
D) All of the above.
A) A test for the equality of variances from 2 independent populations.
B) A test for the difference between the means of 2 related populations.
C) A test for the difference between the means of 2 independent populations.
D) All of the above.
فتح الحزمة
افتح القفل للوصول البطاقات البالغ عددها 190 في هذه المجموعة.
فتح الحزمة
k this deck
19
In testing for differences between the means of two related populations, the null hypothesis is
A) H0 : μD = 2.
B) H0 : μD = 0.
C) H0 : μD < 0.
D) H0 : μD > 0.
A) H0 : μD = 2.
B) H0 : μD = 0.
C) H0 : μD < 0.
D) H0 : μD > 0.
فتح الحزمة
افتح القفل للوصول البطاقات البالغ عددها 190 في هذه المجموعة.
فتح الحزمة
k this deck
20
If we are testing for the difference between the means of 2 related populations with samples of n1 = 20 and n2 = 20, the number of degrees of freedom is equal to
A) 39.
B) 38.
C) 19.
D) 18.
A) 39.
B) 38.
C) 19.
D) 18.
فتح الحزمة
افتح القفل للوصول البطاقات البالغ عددها 190 في هذه المجموعة.
فتح الحزمة
k this deck
21
TABLE 10-3
The use of preservatives by food processors has become a controversial issue. Suppose 2 preservatives are extensively tested and determined safe for use in meats. A processor wants to compare the preservatives for their effects on retarding spoilage. Suppose 15 cuts of fresh meat are treated with preservative I and 15 are treated with preservative II, and the number of hours until spoilage begins is recorded for each of the 30 cuts of meat. The results are summarized in the table below.
Referring to Table 10-3, suppose α = 0.05. Which of the following represents the result of the relevant hypothesis test?
A) The alternative hypothesis is rejected.
B) The null hypothesis is rejected.
C) The null hypothesis is not rejected.
D) Insufficient information exists on which to make a decision.
فتح الحزمة
افتح القفل للوصول البطاقات البالغ عددها 190 في هذه المجموعة.
فتح الحزمة
k this deck
22
TABLE 10-4
A real estate company is interested in testing whether, on average, families in Gotham have been living in their current homes for less time than families in Metropolis have. Assume that the two population variances are equal. A random sample of 100 families from Gotham and a random sample of 150 families in Metropolis yield the following data on length of residence in current homes.
Referring to Table 10-4, what is a point estimate for the mean of the sampling distribution of the difference between the 2 sample means?
A) -22
B) -10
C) -15
D) 0
فتح الحزمة
افتح القفل للوصول البطاقات البالغ عددها 190 في هذه المجموعة.
فتح الحزمة
k this deck
23
TABLE 10-1
Are Japanese managers more motivated than American managers? A randomly selected group of each were administered the Sarnoff Survey of Attitudes Toward Life (SSATL), which measures motivation for upward mobility. The SSATL scores are summarized below.
Referring to Table 10-1, find the p-value if we assume that the alternative hypothesis was a two-tail test.
A) smaller than 0.01
B) between 0.01 and 0.05
C) between 0.05 and 0.1
D) greater than 0.1
فتح الحزمة
افتح القفل للوصول البطاقات البالغ عددها 190 في هذه المجموعة.
فتح الحزمة
k this deck
24
TABLE 10-4
A real estate company is interested in testing whether, on average, families in Gotham have been living in their current homes for less time than families in Metropolis have. Assume that the two population variances are equal. A random sample of 100 families from Gotham and a random sample of 150 families in Metropolis yield the following data on length of residence in current homes.
Referring to Table 10-4, what is(are) the critical value(s) of the relevant hypothesis test if the level of significance is 0.01?
A) t ≅ Z = -1.96
B) t ≅ Z = ±1.96
C) t ≅ Z = -2.080
D) t ≅ Z = -2.33
فتح الحزمة
افتح القفل للوصول البطاقات البالغ عددها 190 في هذه المجموعة.
فتح الحزمة
k this deck
25
TABLE 10-4
A real estate company is interested in testing whether, on average, families in Gotham have been living in their current homes for less time than families in Metropolis have. Assume that the two population variances are equal. A random sample of 100 families from Gotham and a random sample of 150 families in Metropolis yield the following data on length of residence in current homes.
Referring to Table 10-4, what is the estimated standard error of the difference between the 2 sample means?
A) 4.06
B) 5.61
C) 8.01
D) 16.00
فتح الحزمة
افتح القفل للوصول البطاقات البالغ عددها 190 في هذه المجموعة.
فتح الحزمة
k this deck
26
TABLE 10-4
A real estate company is interested in testing whether, on average, families in Gotham have been living in their current homes for less time than families in Metropolis have. Assume that the two population variances are equal. A random sample of 100 families from Gotham and a random sample of 150 families in Metropolis yield the following data on length of residence in current homes.
Referring to Table 10-4, which of the following represents the relevant hypotheses tested by the real estate company?
A)
B)
C)
D)
فتح الحزمة
افتح القفل للوصول البطاقات البالغ عددها 190 في هذه المجموعة.
فتح الحزمة
k this deck
27
TABLE 10-4
A real estate company is interested in testing whether, on average, families in Gotham have been living in their current homes for less time than families in Metropolis have. Assume that the two population variances are equal. A random sample of 100 families from Gotham and a random sample of 150 families in Metropolis yield the following data on length of residence in current homes.
Referring to Table 10-4, what is(are) the critical value(s) of the relevant hypothesis test if the level of significance is 0.05?
A) t ≅ Z = -1.645
B) t ≅ Z = ±1.96
C) t ≅ Z = -1.96
D) t ≅ Z = -2.080
فتح الحزمة
افتح القفل للوصول البطاقات البالغ عددها 190 في هذه المجموعة.
فتح الحزمة
k this deck
28
TABLE 10-3
The use of preservatives by food processors has become a controversial issue. Suppose 2 preservatives are extensively tested and determined safe for use in meats. A processor wants to compare the preservatives for their effects on retarding spoilage. Suppose 15 cuts of fresh meat are treated with preservative I and 15 are treated with preservative II, and the number of hours until spoilage begins is recorded for each of the 30 cuts of meat. The results are summarized in the table below.
Referring to Table 10-3, what is the value of the test statistic for testing if the population variances differ for preservatives I and II?
فتح الحزمة
افتح القفل للوصول البطاقات البالغ عددها 190 في هذه المجموعة.
فتح الحزمة
k this deck
29
TABLE 10-2
A researcher randomly sampled 30 graduates of an MBA program and recorded data concerning their starting salaries. Of primary interest to the researcher was the effect of gender on starting salaries. Analysis of the mean salaries of the females and males in the sample is given below.
Referring to Table 10-2, the researcher was attempting to show statistically that the female MBA graduates have a significantly lower mean starting salary than the male MBA graduates. From the analysis in Table 10-2, the correct test statistic is:
A) 0.0860
B) -1.4019
C) -1.7011
D) -6,733.33
فتح الحزمة
افتح القفل للوصول البطاقات البالغ عددها 190 في هذه المجموعة.
فتح الحزمة
k this deck
30
TABLE 10-2
A researcher randomly sampled 30 graduates of an MBA program and recorded data concerning their starting salaries. Of primary interest to the researcher was the effect of gender on starting salaries. Analysis of the mean salaries of the females and males in the sample is given below.
Referring to Table 10-2, the researcher was attempting to show statistically that the female MBA graduates have a significantly lower mean starting salary than the male MBA graduates. According to the test run, which of the following is an appropriate alternative hypothesis?
A) H1 : μfemales > μmales
B) H1 : μfemales < μmales
C) H1 : μfemales ≠ μmales
D) H1 : μfemales = μmales
فتح الحزمة
افتح القفل للوصول البطاقات البالغ عددها 190 في هذه المجموعة.
فتح الحزمة
k this deck
31
TABLE 10-3
The use of preservatives by food processors has become a controversial issue. Suppose 2 preservatives are extensively tested and determined safe for use in meats. A processor wants to compare the preservatives for their effects on retarding spoilage. Suppose 15 cuts of fresh meat are treated with preservative I and 15 are treated with preservative II, and the number of hours until spoilage begins is recorded for each of the 30 cuts of meat. The results are summarized in the table below.
Referring to Table 10-3,
A) There is no evidence of a difference in the population variances between preservatives I and II.
B) There is evidence of a difference in the population variances between preservatives I and II.
C) There is no evidence that the population variances between preservatives I and II are the same.
D) There is evidence that the population variances between preservatives I and II are the same.
فتح الحزمة
افتح القفل للوصول البطاقات البالغ عددها 190 في هذه المجموعة.
فتح الحزمة
k this deck
32
TABLE 10-3
The use of preservatives by food processors has become a controversial issue. Suppose 2 preservatives are extensively tested and determined safe for use in meats. A processor wants to compare the preservatives for their effects on retarding spoilage. Suppose 15 cuts of fresh meat are treated with preservative I and 15 are treated with preservative II, and the number of hours until spoilage begins is recorded for each of the 30 cuts of meat. The results are summarized in the table below.
Referring to Table 10-3, state the null and alternative hypotheses for testing if the population variances differ for preservatives I and II.
A)
B)
C)
D)
فتح الحزمة
افتح القفل للوصول البطاقات البالغ عددها 190 في هذه المجموعة.
فتح الحزمة
k this deck
33
TABLE 10-2
A researcher randomly sampled 30 graduates of an MBA program and recorded data concerning their starting salaries. Of primary interest to the researcher was the effect of gender on starting salaries. Analysis of the mean salaries of the females and males in the sample is given below.
Referring to Table 10-2, what is the 90% confidence interval estimate for the difference between two means?
فتح الحزمة
افتح القفل للوصول البطاقات البالغ عددها 190 في هذه المجموعة.
فتح الحزمة
k this deck
34
TABLE 10-3
The use of preservatives by food processors has become a controversial issue. Suppose 2 preservatives are extensively tested and determined safe for use in meats. A processor wants to compare the preservatives for their effects on retarding spoilage. Suppose 15 cuts of fresh meat are treated with preservative I and 15 are treated with preservative II, and the number of hours until spoilage begins is recorded for each of the 30 cuts of meat. The results are summarized in the table below.
Referring to Table 10-3, what is the largest level of significance at which a test if the population variances differ for preservatives I and II will not be rejected?
فتح الحزمة
افتح القفل للوصول البطاقات البالغ عددها 190 في هذه المجموعة.
فتح الحزمة
k this deck
35
TABLE 10-2
A researcher randomly sampled 30 graduates of an MBA program and recorded data concerning their starting salaries. Of primary interest to the researcher was the effect of gender on starting salaries. Analysis of the mean salaries of the females and males in the sample is given below.
Referring to Table 10-2, the researcher was attempting to show statistically that the female MBA graduates have a significantly lower mean starting salary than the male MBA graduates. The proper conclusion for this test is:
A) At the α = 0.10 level, there is sufficient evidence to indicate a difference in the mean starting salaries of male and female MBA graduates.
B) At the α = 0.10 level, there is sufficient evidence to indicate that females have a lower mean starting salary than male MBA graduates.
C) At the α = 0.10 level, there is sufficient evidence to indicate that females have a higher mean starting salary than male MBA graduates.
D) At the α = 0.10 level, there is insufficient evidence to indicate any difference in the mean starting salaries of male and female MBA graduates.
فتح الحزمة
افتح القفل للوصول البطاقات البالغ عددها 190 في هذه المجموعة.
فتح الحزمة
k this deck
36
TABLE 10-2
A researcher randomly sampled 30 graduates of an MBA program and recorded data concerning their starting salaries. Of primary interest to the researcher was the effect of gender on starting salaries. Analysis of the mean salaries of the females and males in the sample is given below.
Referring to Table 10-2, what is the 99% confidence interval estimate for the difference between two means?
فتح الحزمة
افتح القفل للوصول البطاقات البالغ عددها 190 في هذه المجموعة.
فتح الحزمة
k this deck
37
TABLE 10-3
The use of preservatives by food processors has become a controversial issue. Suppose 2 preservatives are extensively tested and determined safe for use in meats. A processor wants to compare the preservatives for their effects on retarding spoilage. Suppose 15 cuts of fresh meat are treated with preservative I and 15 are treated with preservative II, and the number of hours until spoilage begins is recorded for each of the 30 cuts of meat. The results are summarized in the table below.
Referring to Table 10-3, what is the critical value for testing if the population variances differ for preservatives I and II at the 5% level of significance?
فتح الحزمة
افتح القفل للوصول البطاقات البالغ عددها 190 في هذه المجموعة.
فتح الحزمة
k this deck
38
TABLE 10-2
A researcher randomly sampled 30 graduates of an MBA program and recorded data concerning their starting salaries. Of primary interest to the researcher was the effect of gender on starting salaries. Analysis of the mean salaries of the females and males in the sample is given below.
Referring to Table 10-2, what is the 95% confidence interval estimate for the difference between two means?
فتح الحزمة
افتح القفل للوصول البطاقات البالغ عددها 190 في هذه المجموعة.
فتح الحزمة
k this deck
39
TABLE 10-3
The use of preservatives by food processors has become a controversial issue. Suppose 2 preservatives are extensively tested and determined safe for use in meats. A processor wants to compare the preservatives for their effects on retarding spoilage. Suppose 15 cuts of fresh meat are treated with preservative I and 15 are treated with preservative II, and the number of hours until spoilage begins is recorded for each of the 30 cuts of meat. The results are summarized in the table below.
Referring to Table 10-3, what assumptions are necessary for testing if the population variances differ for preservatives I and II?
A) Both sampled populations are normally distributed.
B) Both samples are random and independent.
C) Neither A nor B is necessary.
D) Both A and B are necessary.
فتح الحزمة
افتح القفل للوصول البطاقات البالغ عددها 190 في هذه المجموعة.
فتح الحزمة
k this deck
40
TABLE 10-2
A researcher randomly sampled 30 graduates of an MBA program and recorded data concerning their starting salaries. Of primary interest to the researcher was the effect of gender on starting salaries. Analysis of the mean salaries of the females and males in the sample is given below.
Referring to Table 10-2, the researcher was attempting to show statistically that the female MBA graduates have a significantly lower mean starting salary than the male MBA graduates. What assumptions were necessary to conduct this hypothesis test?
A) Both populations of salaries (male and female) must have approximate normal distributions.
B) The population variances are approximately equal.
C) The samples were randomly and independently selected.
D) All of the above assumptions were necessary.
فتح الحزمة
افتح القفل للوصول البطاقات البالغ عددها 190 في هذه المجموعة.
فتح الحزمة
k this deck
41
TABLE 10-5
To test the effectiveness of a business school preparation course, 8 students took a general business test before and after the course. The results are given below.
Referring to Table 10-5, one must assume that the population of difference scores is normally distributed.
To test the effectiveness of a business school preparation course, 8 students took a general business test before and after the course. The results are given below.
Referring to Table 10-5, one must assume that the population of difference scores is normally distributed.
فتح الحزمة
افتح القفل للوصول البطاقات البالغ عددها 190 في هذه المجموعة.
فتح الحزمة
k this deck
42
The sample size in each independent sample must be the same if we are to test for differences between the means of 2 independent populations.
فتح الحزمة
افتح القفل للوصول البطاقات البالغ عددها 190 في هذه المجموعة.
فتح الحزمة
k this deck
43
TABLE 10-4
A real estate company is interested in testing whether, on average, families in Gotham have been living in their current homes for less time than families in Metropolis have. Assume that the two population variances are equal. A random sample of 100 families from Gotham and a random sample of 150 families in Metropolis yield the following data on length of residence in current homes.
Referring to Table 10-4, suppose α = 0.10. Which of the following represents the correct conclusion?
A) There is not enough evidence that the mean amount of time families in Gotham have been living in their current homes is less than families in Metropolis.
B) There is enough evidence that the mean amount of time families in Gotham have been living in their current homes is less than families in Metropolis.
C) There is not enough evidence that the mean amount of time families in Gotham have been living in their current homes is not less than families in Metropolis.
D) There is enough evidence that the mean amount of time families in Gotham have been living in their current homes is not less than families in Metropolis.
فتح الحزمة
افتح القفل للوصول البطاقات البالغ عددها 190 في هذه المجموعة.
فتح الحزمة
k this deck
44
TABLE 10-4
A real estate company is interested in testing whether, on average, families in Gotham have been living in their current homes for less time than families in Metropolis have. Assume that the two population variances are equal. A random sample of 100 families from Gotham and a random sample of 150 families in Metropolis yield the following data on length of residence in current homes.
Referring to Table 10-4, what is the 95% confidence interval estimate for the difference in the two means?
فتح الحزمة
افتح القفل للوصول البطاقات البالغ عددها 190 في هذه المجموعة.
فتح الحزمة
k this deck
45
TABLE 10-4
A real estate company is interested in testing whether, on average, families in Gotham have been living in their current homes for less time than families in Metropolis have. Assume that the two population variances are equal. A random sample of 100 families from Gotham and a random sample of 150 families in Metropolis yield the following data on length of residence in current homes.
Referring to Table 10-4, what is the standardized value of the estimate of the mean of the sampling distribution of the difference between sample means?
A) -8.75
B) -3.69
C) -2.33
D) -1.96
فتح الحزمة
افتح القفل للوصول البطاقات البالغ عددها 190 في هذه المجموعة.
فتح الحزمة
k this deck
46
TABLE 10-4
A real estate company is interested in testing whether, on average, families in Gotham have been living in their current homes for less time than families in Metropolis have. Assume that the two population variances are equal. A random sample of 100 families from Gotham and a random sample of 150 families in Metropolis yield the following data on length of residence in current homes.
Referring to Table 10-4, what is the 99% confidence interval estimate for the difference in the two means?
فتح الحزمة
افتح القفل للوصول البطاقات البالغ عددها 190 في هذه المجموعة.
فتح الحزمة
k this deck
47
TABLE 10-4
A real estate company is interested in testing whether, on average, families in Gotham have been living in their current homes for less time than families in Metropolis have. Assume that the two population variances are equal. A random sample of 100 families from Gotham and a random sample of 150 families in Metropolis yield the following data on length of residence in current homes.
Referring to Table 10-4, suppose α = 0.10. Which of the following represents the result of the relevant hypothesis test?
A) The alternative hypothesis is rejected.
B) The null hypothesis is rejected.
C) The null hypothesis is not rejected.
D) Insufficient information exists on which to make a decision.
فتح الحزمة
افتح القفل للوصول البطاقات البالغ عددها 190 في هذه المجموعة.
فتح الحزمة
k this deck
48
TABLE 10-4
A real estate company is interested in testing whether, on average, families in Gotham have been living in their current homes for less time than families in Metropolis have. Assume that the two population variances are equal. A random sample of 100 families from Gotham and a random sample of 150 families in Metropolis yield the following data on length of residence in current homes.
Referring to Table 10-4, suppose α = 0.05. Which of the following represents the result of the relevant hypothesis test?
A) The alternative hypothesis is rejected.
B) The null hypothesis is rejected.
C) The null hypothesis is not rejected.
D) Insufficient information exists on which to make a decision.
فتح الحزمة
افتح القفل للوصول البطاقات البالغ عددها 190 في هذه المجموعة.
فتح الحزمة
k this deck
49
TABLE 10-5
To test the effectiveness of a business school preparation course, 8 students took a general business test before and after the course. The results are given below.
Referring to Table 10-5, at the 0.05 level of significance, the decision for this hypothesis test would be:
A) reject the null hypothesis.
B) do not reject the null hypothesis.
C) reject the alternative hypothesis.
D) It cannot be determined from the information given.
فتح الحزمة
افتح القفل للوصول البطاقات البالغ عددها 190 في هذه المجموعة.
فتح الحزمة
k this deck
50
TABLE 10-5
To test the effectiveness of a business school preparation course, 8 students took a general business test before and after the course. The results are given below.
Referring to Table 10-5, the p-value of the test statistic is ________.
To test the effectiveness of a business school preparation course, 8 students took a general business test before and after the course. The results are given below.
Referring to Table 10-5, the p-value of the test statistic is ________.
فتح الحزمة
افتح القفل للوصول البطاقات البالغ عددها 190 في هذه المجموعة.
فتح الحزمة
k this deck
51
TABLE 10-5
To test the effectiveness of a business school preparation course, 8 students took a general business test before and after the course. The results are given below.
Referring to Table 10-5, what is the critical value for testing at the 5% level of significance whether the business school preparation course is effective in improving exam scores?
A) 2.365
B) 2.145
C) 1.761
D) 1.895
فتح الحزمة
افتح القفل للوصول البطاقات البالغ عددها 190 في هذه المجموعة.
فتح الحزمة
k this deck
52
TABLE 10-5
To test the effectiveness of a business school preparation course, 8 students took a general business test before and after the course. The results are given below.
Referring to Table 10-5, in examining the differences between related samples we are essentially sampling from an underlying population of difference "scores."
فتح الحزمة
افتح القفل للوصول البطاقات البالغ عددها 190 في هذه المجموعة.
فتح الحزمة
k this deck
53
TABLE 10-4
A real estate company is interested in testing whether, on average, families in Gotham have been living in their current homes for less time than families in Metropolis have. Assume that the two population variances are equal. A random sample of 100 families from Gotham and a random sample of 150 families in Metropolis yield the following data on length of residence in current homes.
Referring to Table 10-4, suppose α = 0.01. Which of the following represents the result of the relevant hypothesis test?
A) The alternative hypothesis is rejected.
B) The null hypothesis is rejected.
C) The null hypothesis is not rejected.
D) Insufficient information exists on which to make a decision.
فتح الحزمة
افتح القفل للوصول البطاقات البالغ عددها 190 في هذه المجموعة.
فتح الحزمة
k this deck
54
TABLE 10-4
A real estate company is interested in testing whether, on average, families in Gotham have been living in their current homes for less time than families in Metropolis have. Assume that the two population variances are equal. A random sample of 100 families from Gotham and a random sample of 150 families in Metropolis yield the following data on length of residence in current homes.
Referring to Table 10-4, suppose α = 0.05. Which of the following represents the correct conclusion?
A) There is not enough evidence that the mean amount of time families in Gotham have been living in their current homes is less than families in Metropolis.
B) There is enough evidence that the mean amount of time families in Gotham have been living in their current homes is less than families in Metropolis.
C) There is not enough evidence that the mean amount of time families in Gotham have been living in their current homes is not less than families in Metropolis.
D) There is enough evidence that the mean amount of time families in Gotham have been living in their current homes is not less than families in Metropolis.
فتح الحزمة
افتح القفل للوصول البطاقات البالغ عددها 190 في هذه المجموعة.
فتح الحزمة
k this deck
55
TABLE 10-4
A real estate company is interested in testing whether, on average, families in Gotham have been living in their current homes for less time than families in Metropolis have. Assume that the two population variances are equal. A random sample of 100 families from Gotham and a random sample of 150 families in Metropolis yield the following data on length of residence in current homes.
Referring to Table 10-4, suppose α = 0.01. Which of the following represents the correct conclusion?
A) There is not enough evidence that the mean amount of time families in Gotham have been living in their current homes is less than families in Metropolis.
B) There is enough evidence that the mean amount of time families in Gotham have been living in their current homes is less than families in Metropolis.
C) There is not enough evidence that the mean amount of time families in Gotham have been living in their current homes is not less than families in Metropolis.
D) There is enough evidence that the mean amount of time families in Gotham have been living in their current homes is not less than families in Metropolis.
فتح الحزمة
افتح القفل للوصول البطاقات البالغ عددها 190 في هذه المجموعة.
فتح الحزمة
k this deck
56
TABLE 10-5
To test the effectiveness of a business school preparation course, 8 students took a general business test before and after the course. The results are given below.
Referring to Table 10-5, the number of degrees of freedom is
A) 14.
B) 13.
C) 8.
D) 7.
To test the effectiveness of a business school preparation course, 8 students took a general business test before and after the course. The results are given below.
Referring to Table 10-5, the number of degrees of freedom is
A) 14.
B) 13.
C) 8.
D) 7.
فتح الحزمة
افتح القفل للوصول البطاقات البالغ عددها 190 في هذه المجموعة.
فتح الحزمة
k this deck
57
TABLE 10-5
To test the effectiveness of a business school preparation course, 8 students took a general business test before and after the course. The results are given below.
Referring to Table 10-5, the value of the standard error of the difference scores is
A) 65.027.
B) 60.828.
C) 22.991.
D) 14.696.
To test the effectiveness of a business school preparation course, 8 students took a general business test before and after the course. The results are given below.
Referring to Table 10-5, the value of the standard error of the difference scores is
A) 65.027.
B) 60.828.
C) 22.991.
D) 14.696.
فتح الحزمة
افتح القفل للوصول البطاقات البالغ عددها 190 في هذه المجموعة.
فتح الحزمة
k this deck
58
TABLE 10-5
To test the effectiveness of a business school preparation course, 8 students took a general business test before and after the course. The results are given below.
Referring to Table 10-5, the value of the sample mean difference is ________ if the difference scores reflect the results of the exam after the course minus the results of the exam before the course.
A) 0
B) 50
C) 68
D) 400
فتح الحزمة
افتح القفل للوصول البطاقات البالغ عددها 190 في هذه المجموعة.
فتح الحزمة
k this deck
59
TABLE 10-5
To test the effectiveness of a business school preparation course, 8 students took a general business test before and after the course. The results are given below.
Referring to Table 10-5, the calculated value of the test statistic is ________.
To test the effectiveness of a business school preparation course, 8 students took a general business test before and after the course. The results are given below.
Referring to Table 10-5, the calculated value of the test statistic is ________.
فتح الحزمة
افتح القفل للوصول البطاقات البالغ عددها 190 في هذه المجموعة.
فتح الحزمة
k this deck
60
TABLE 10-5
To test the effectiveness of a business school preparation course, 8 students took a general business test before and after the course. The results are given below.
Referring to Table 10-5, at the 0.05 level of significance, the conclusion for this hypothesis test would be:
A) the business school preparation course does improve exam score.
B) the business school preparation course does not improve exam score.
C) the business school preparation course has no impact on exam score.
D) No conclusion can be drawn from the information given.
فتح الحزمة
افتح القفل للوصول البطاقات البالغ عددها 190 في هذه المجموعة.
فتح الحزمة
k this deck
61
When testing for differences between the means of 2 related populations, we can use either a one-tail or two-tail test.
فتح الحزمة
افتح القفل للوصول البطاقات البالغ عددها 190 في هذه المجموعة.
فتح الحزمة
k this deck
62
For all two-sample tests, the sample sizes must be equal in the 2 groups.
فتح الحزمة
افتح القفل للوصول البطاقات البالغ عددها 190 في هذه المجموعة.
فتح الحزمة
k this deck
63
When we test for differences between the means of 2 independent populations, we can only use a two-tail test.
فتح الحزمة
افتح القفل للوصول البطاقات البالغ عددها 190 في هذه المجموعة.
فتح الحزمة
k this deck
64
When testing H0 : π1 - π2 ≤ 0 versus H1 : π1 - π2 > 0, the observed value of the Z-score was found to be -2.13. The p-value for this test would be
A) 0.0166.
B) 0.0332.
C) 0.9668.
D) 0.9834.
A) 0.0166.
B) 0.0332.
C) 0.9668.
D) 0.9834.
فتح الحزمة
افتح القفل للوصول البطاقات البالغ عددها 190 في هذه المجموعة.
فتح الحزمة
k this deck
65
When testing H0 : π1 - π2 = 0 versus H1 : π1 - π2 ≠ 0, the observed value of the Z-score was found to be -2.13. The p-value for this test would be
A) 0.0166.
B) 0.0332.
C) 0.9668.
D) 0.9834.
A) 0.0166.
B) 0.0332.
C) 0.9668.
D) 0.9834.
فتح الحزمة
افتح القفل للوصول البطاقات البالغ عددها 190 في هذه المجموعة.
فتح الحزمة
k this deck
66
TABLE 10-6
Two samples each of size 25 are taken from independent populations assumed to be normally distributed with equal variances. The first sample has a mean of 35.5 and standard deviation of 3.0 while the second sample has a mean of 33.0 and standard deviation of 4.0.
Referring to Table 10-6, the computed t statistic is ________.
فتح الحزمة
افتح القفل للوصول البطاقات البالغ عددها 190 في هذه المجموعة.
فتح الحزمة
k this deck
67
F tests are one-tail tests.
فتح الحزمة
افتح القفل للوصول البطاقات البالغ عددها 190 في هذه المجموعة.
فتح الحزمة
k this deck
68
When testing H0 : π1 - π2 ≥ 0 versus H1 : π1 - π2 < 0, the observed value of the Z-score was found to be -2.13. The p-value for this test would be
A) 0.0166.
B) 0.0332.
C) 0.9668.
D) 0.9834.
A) 0.0166.
B) 0.0332.
C) 0.9668.
D) 0.9834.
فتح الحزمة
افتح القفل للوصول البطاقات البالغ عددها 190 في هذه المجموعة.
فتح الحزمة
k this deck
69
TABLE 10-6
Two samples each of size 25 are taken from independent populations assumed to be normally distributed with equal variances. The first sample has a mean of 35.5 and standard deviation of 3.0 while the second sample has a mean of 33.0 and standard deviation of 4.0.
Referring to Table 10-6, the pooled (i.e., combined) variance is ________.
فتح الحزمة
افتح القفل للوصول البطاقات البالغ عددها 190 في هذه المجموعة.
فتح الحزمة
k this deck
70
Repeated measurements from the same individuals is an example of data collected from 2 related populations.
فتح الحزمة
افتح القفل للوصول البطاقات البالغ عددها 190 في هذه المجموعة.
فتح الحزمة
k this deck
71
When the sample sizes are equal, the pooled variance of the 2 groups is the average of the 2 sample variances.
فتح الحزمة
افتح القفل للوصول البطاقات البالغ عددها 190 في هذه المجموعة.
فتح الحزمة
k this deck
72
A statistics professor wanted to test whether the grades on a statistics test were the same for upper and lower classmen. The professor took a random sample of size 10 from each, conducted a test and found out that the variances were equal. For this situation, the professor should use a t test with related samples.
فتح الحزمة
افتح القفل للوصول البطاقات البالغ عددها 190 في هذه المجموعة.
فتح الحزمة
k this deck
73
A researcher is curious about the effect of sleep on students' test performances. He chooses 60 students and gives each 2 tests: one given after 2 hours' sleep and one after 8 hours' sleep. The test the researcher should use would be a related samples test.
فتح الحزمة
افتح القفل للوصول البطاقات البالغ عددها 190 في هذه المجموعة.
فتح الحزمة
k this deck
74
The test for the equality of 2 population variances assumes that each of the 2 populations is normally distributed.
فتح الحزمة
افتح القفل للوصول البطاقات البالغ عددها 190 في هذه المجموعة.
فتح الحزمة
k this deck
75
The F distribution can only have positive values.
فتح الحزمة
افتح القفل للوصول البطاقات البالغ عددها 190 في هذه المجموعة.
فتح الحزمة
k this deck
76
A statistics professor wanted to test whether the grades on a statistics test were the same for upper and lower classmen. The professor took a random sample of size 10 from each, conducted a test and found out that the variances were equal. For this situation, the professor should use a t test with independent samples.
فتح الحزمة
افتح القفل للوصول البطاقات البالغ عددها 190 في هذه المجموعة.
فتح الحزمة
k this deck
77
A Marine drill instructor recorded the time in which each of 11 recruits completed an obstacle course both before and after basic training. To test whether any improvement occurred, the instructor would use a t-distribution with 10 degrees of freedom.
فتح الحزمة
افتح القفل للوصول البطاقات البالغ عددها 190 في هذه المجموعة.
فتح الحزمة
k this deck
78
TABLE 10-6
Two samples each of size 25 are taken from independent populations assumed to be normally distributed with equal variances. The first sample has a mean of 35.5 and standard deviation of 3.0 while the second sample has a mean of 33.0 and standard deviation of 4.0.
Referring to Table 10-6, there are ________ degrees of freedom for this test.
فتح الحزمة
افتح القفل للوصول البطاقات البالغ عددها 190 في هذه المجموعة.
فتح الحزمة
k this deck
79
The F distribution is symmetric.
فتح الحزمة
افتح القفل للوصول البطاقات البالغ عددها 190 في هذه المجموعة.
فتح الحزمة
k this deck
80
A Marine drill instructor recorded the time in which each of 11 recruits completed an obstacle course both before and after basic training. To test whether any improvement occurred, the instructor would use a t-distribution with 11 degrees of freedom.
فتح الحزمة
افتح القفل للوصول البطاقات البالغ عددها 190 في هذه المجموعة.
فتح الحزمة
k this deck
فتح الحزمة
افتح القفل للوصول البطاقات البالغ عددها 190 في هذه المجموعة.


